- LTC price remains bullish as it breaks outside the descending parallel channel price range.
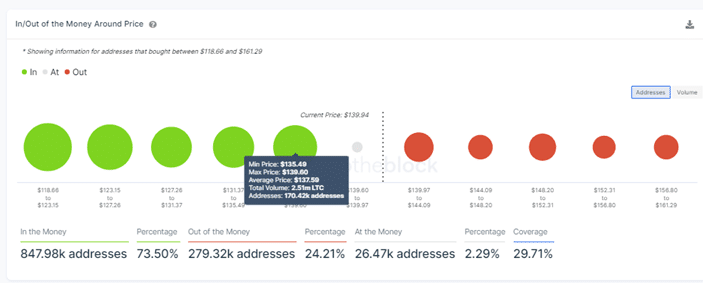
- IOMAP shows Litecoin sitting on strong support at $136 with relatively weak upward hurdles.
On Monday the LTC price broke above the $135 psychological level as bulls flexed their muscles to push Litecoin higher. However, bulls soon ran out of steam and LTC retreated to close the day at around $131. Before that, LTC lost 25% from a high of around $140 to a low about $103 between July 12 and July 20. During the downfall, Litecoin flipped the 50 and the 100 Simple Moving Averaged (SMAs) from support to resistance and reversed the parabolic SAR from positive to negative as seen on the four-hour chart.
LTC Price Upward Rally Depends On This Crucial Support
LTC has been bullish since July 21 rising by approximately 32% from $103 to the current price at $140. The rally saw LTC price flip the 50, 100 and 200 SMAs from resistance to support. On Monday, the bullish run saw the Litecoin price record highs above the $140 mark. However, the bullish momentum was not strong enough to keep LTC price above the $140 psychological level as it retracted on to close the day in the red at $130. An area that now acts as immediate support coinciding with the 200 SMA.
During today’s early trading sessions, LTC broke outside the trading range defined by the descending parallel channel to rise above the $140 mark again. Litecoin is currently hovering around $140 on crypto exchanges and appears to be battling immediate resistance at $142. Note that a session closure above this level could see LTC explore the June 29 highs around the $150 psychological level.
LTC Price Four-Hour Chart
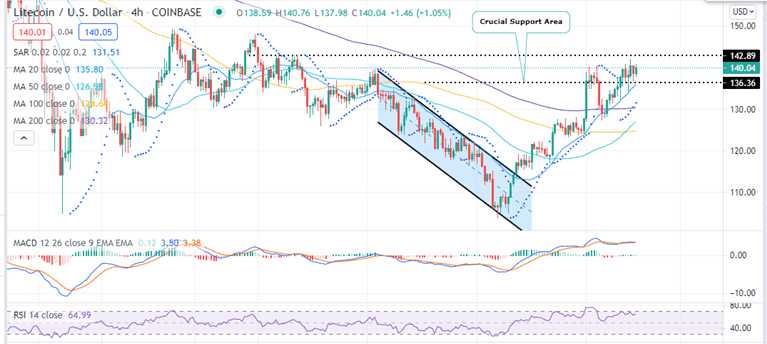
Note that for this narrative to hold, the support at around $136 to make sure that overhead pressure does not push LTC price below this point.
- Are you new to crypto trading? Read the how to buy cryptocurrency guide to get started.
IntoTheBlock’s In/Out of the Money Around Price (IOMAP) on-chain metrics indicate that the support at $136 is relatively strong to keep LTC’s price going higher. It lies within the $135 and $139 investor cluster where approximately 2.5 million LTC were previously bought by roughly 170,000 addresses.
The same IOMAP model shows that LTC faces relatively weak resistance upwards. The immediate major resistance at $142 lies with the $139 to $144 price range where only 72,00 addresses previously bought 968,000 LTC.
Compared to the support downward, this resistance should not be a problem to bulls who seek to break out above $140 to push the Litecoin price to the moon.
Litecoin Price IOMAP Model
How Can the Bullish Outlook Be Invalidated?
On the flip-side, if LTC fails to close the day above the $140 psychological level, sellers might enter the scene to push the price lower. If this happens, Litecoin could re-test the $130 support at the 200-SMA. A further retraction could see the LTC price drop to $124 and $115 respectively.
