- LTC/USD bulls try to breach the resistance offered by the 200-day simple moving average (SMA 200).
- The market is becoming increasingly volatile as LTC/USD creeps towards the overbought zone.
The bulls took over the LTC/USD market this Friday as the price sits over the $41 support line. The buyers will need to rally together and breach the resistance provided by the 200-day simple moving average (SMA 200) curve. However, as the price creeps towards the overbought zone, it may incentivize sellers to sell off their assets.
LTC/USD daily chart
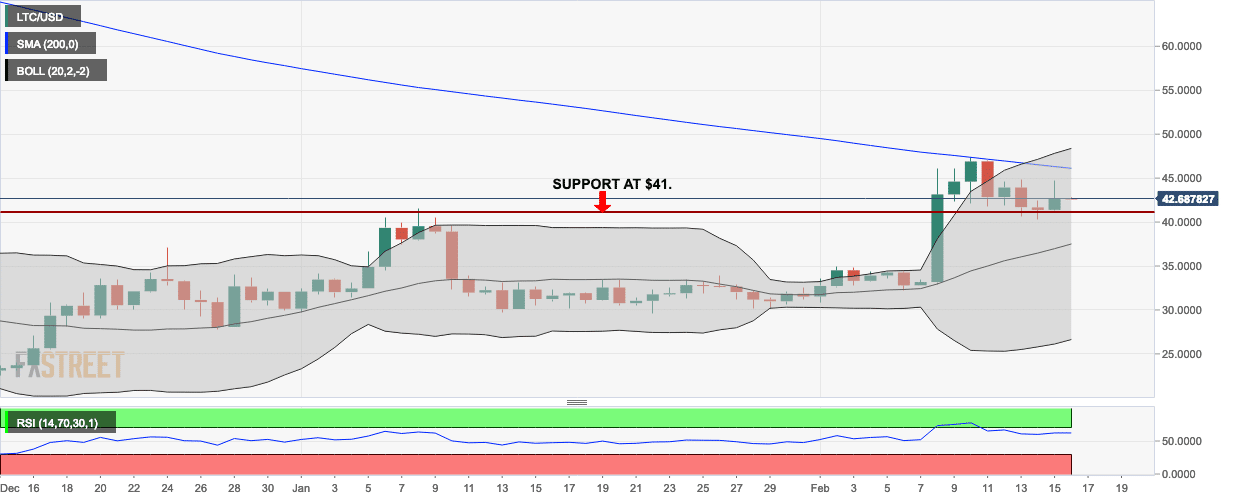
The price currently is trending on the upper half of the 20-day Bollinger band which signifies a bullish market. The Relative Strength Index (RSI) curve is creeping towards the overbought zone which shows a sell signal. While the buyers may be dominating now, they may lose their momentum to the sellers soon.
