LTC/USD daily chart
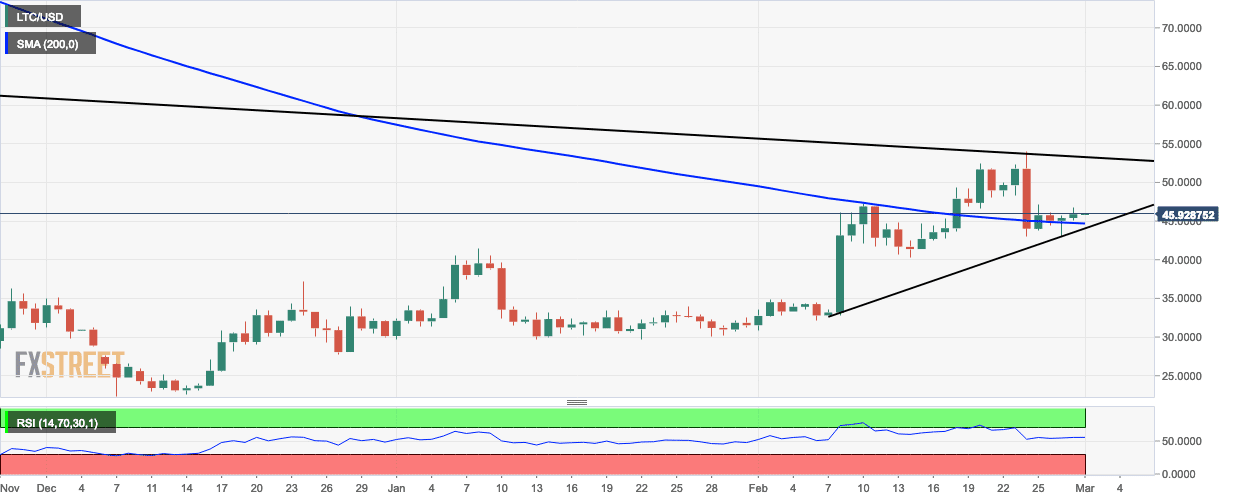
- LTC/USD is currently priced at $46.
- LTC/USD daily market is trending above the 200-day simple moving average (SMA 200) curve
- The relative strength index(RSI) curve is trending around the neutral zone.
LTC/USD 4-hour chart
-636869978896582986.png)
- The LTC/USD 4-hour chart’s moving average convergence/divergence (MACD) histogram shows growing bullish momentum.
LTC/USD hourly chart
-636869979176900903.png)
- The 20-day Bollinger band shows that the last two sessions are trending below the SMA 20 curve. This indicates bearish behavior.
- The SMA 20 curve had already crossed over the SMA 50 curve which indicates a buy signal.
Key Levels
- Resistance 3: $49.1314
- Resistance 2: $47.4334
- Resistance 1: $46.4136
- Pivot Point: $44.7156
- Support 1: $43.6958
- Support 2: $41.9978
- Support 3: $40.9779
