- LTC/USD is sitting below two prominent resistance levels.
- LTC/USD daily chart has had three bearish sessions in a row. Currently, it is trading at $58.95.
LTC/USD is currently trading at $58.95 and is sitting directly below a strong resistance level at $59, as per the daily confluence detector. There are no prominent support levels below the price which shows that the LTC/USD can go down even lower.
LTC/USD daily confluence detector
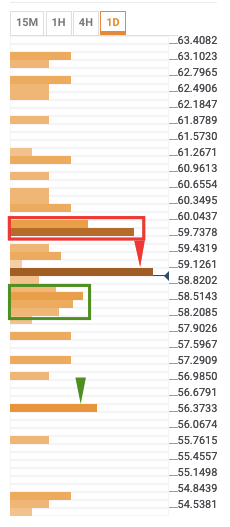
LTC/USD has prominent support levels at $58 – $58.60 and $56.50. The confluences at those levels are:
- $58 – $58.60: 10-day simple moving average (SMA 10), hourly previous high, hourly Bollinger band middle curve, SMA 5, SMA 50, daily Bolinger band middle curve, 15-min Bollinger band middle curve, daily previous low, 4-hour previous low, and daily pivot point support 1.
- $56.50: Monthly pivot point resistance 1.
The resistance levels lie at $59 and $59.50 – $60. The confluences at those levels are:
- $59: Daily 23.6% Fibonacci retracement level, 4-hour previous high, SMA 10, and weekly 23.6% Fibonacci retracement level.
- $59.50 – $60: 4-hour Bollinger band middle curve, SMA 100, SMA 200, SMA 50, weekly 38.2% Fibonacci retracement level, SMA 5, and daily 61.8% Fibonacci retracement level.
