LTC/USD daily chart
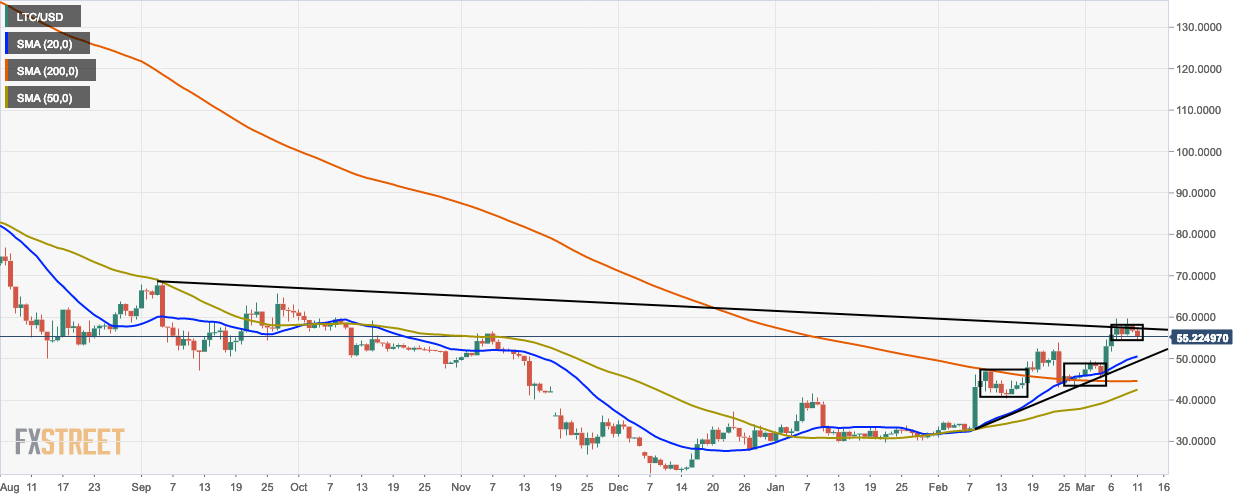
- LTC/USD daily chart has multiple flag formations and is ready for a breakout.
- The market is trending above the 20-day simple moving average (SMA 20), SMA 50, and SMA 200 curves.
- The SMA 50 is going to cross over the SMA 200 soon which will indicate the golden cross buy sign.
- The market is struggling to breach past the long-running downward trending line.
LTC/USD 4-hour chart
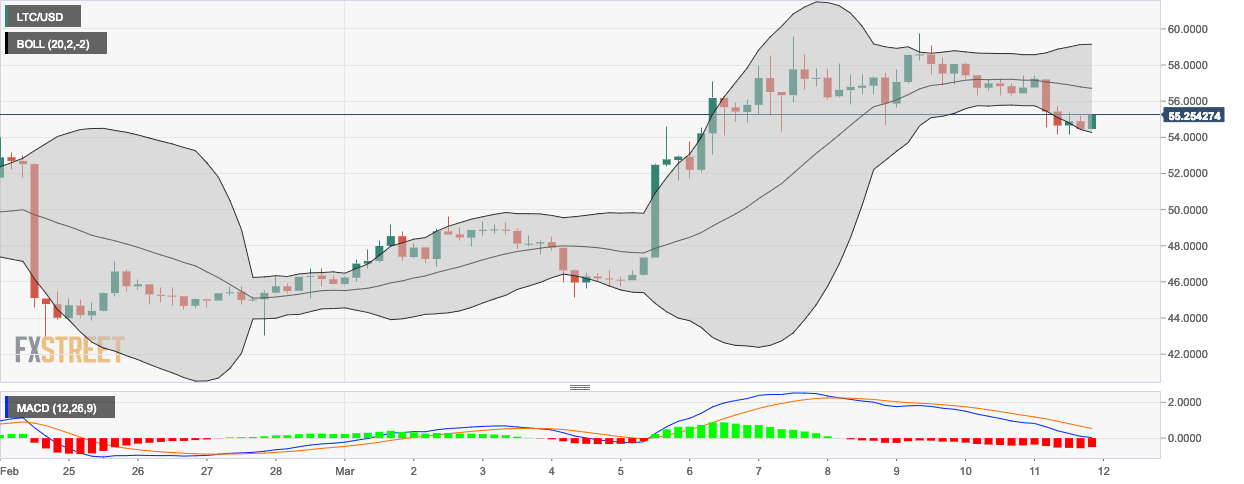
- The LTC/USD 4-hour chart’s moving average convergence/divergence (MACD) shows increasing bearish momentum.
- The last session took the market above the lower curve of the 20-day Bollinger band which shows that the bulls are trying to rally back.
LTC/USD hourly chart
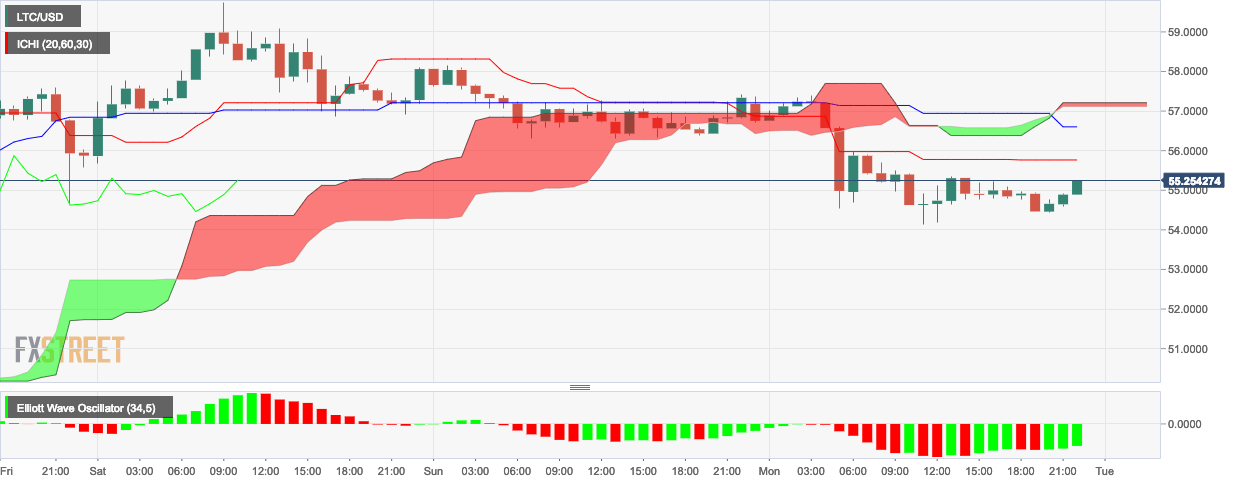
- The Ichimoku indicator in the LTC/USD hourly chart shows that current market sentiment is a little bullish, however, it will show bearish behavior soon.
- The last three sessions in the Elliot wave oscillator shows bullish movement.
Key Levels
- Resistance 3: $59.6579
- Resistance 2: $58.8992
- Resistance 1: $57.8264
- Pivot Point: $57.0677
- Support 1: $55.9949
- Support 2: $55.2361
- Support 3: $54.1633
