- LTC/USD price fell slightly from $45.80 to $45 this Tuesday.
- Technical analysis shows several bullish indicators which may hint at an upcoming breakout.
LTC/USD daily chart
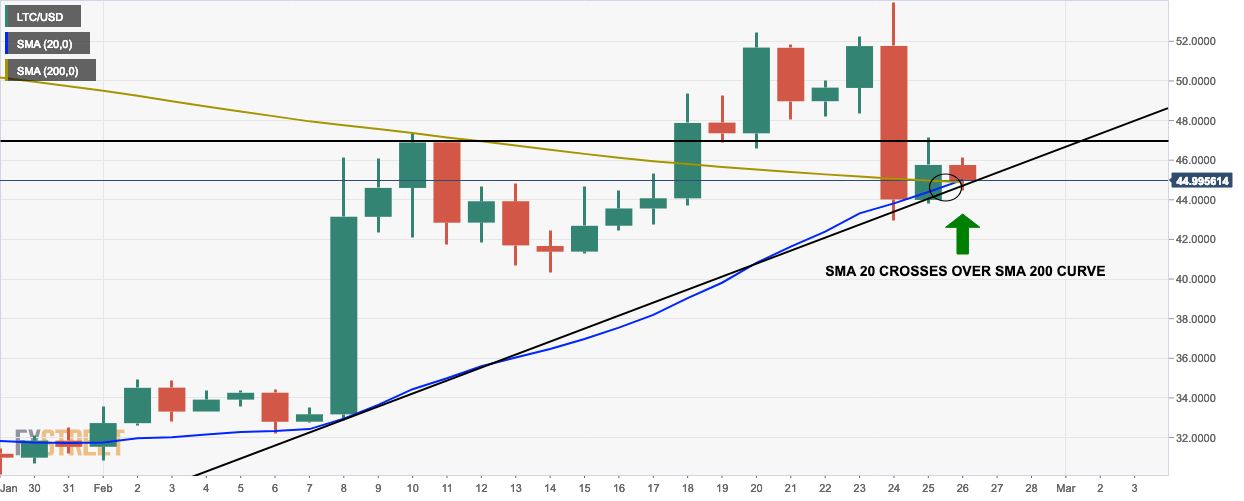
- LTC/USD price went down from $45.80 to $45 and it is trending below both the 20-day simple moving average (SMA 20) curve and the SMA 200 curve.
- The SMA 20 curve has crossed over the SMA 200 curve which indicates a buy signal.
LTC/USD 4-hour chart
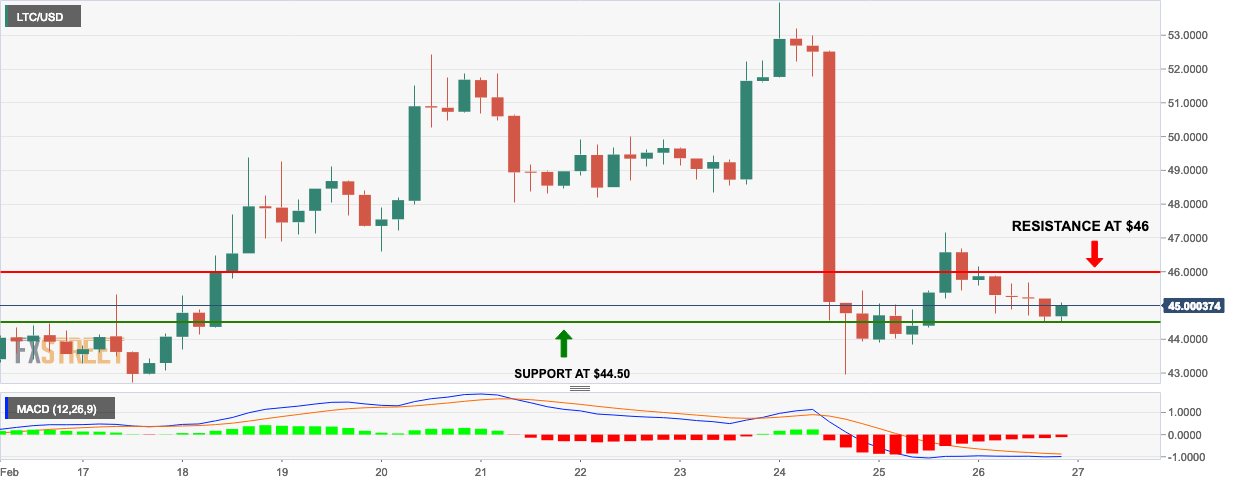
- The LTC/USD 4-hour chart has found support at $44.50.
- The moving average convergence/divergence (MACD) histogram shows that the bearish momentum is decreasing.
LTC/USD hourly
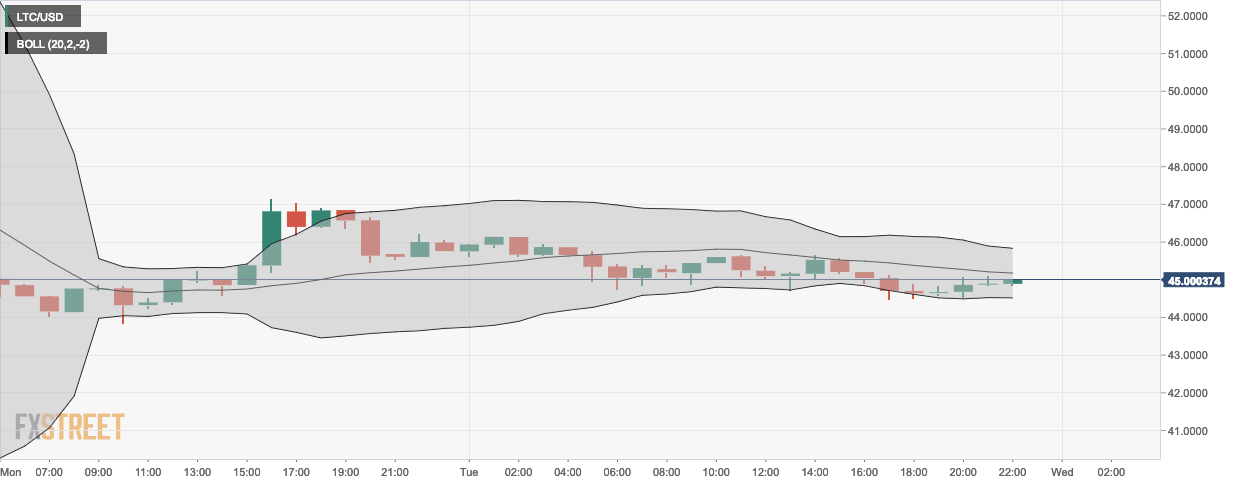
- The LTC/USD hourly chart shows decreasing volatility in price according to the 20-day Bollinger band.
- The last two sessions show that the price is creeping towards the 20-day simple moving average (SMA 20) curve.
Key Levels
- Resistance 3: $50.6432
- Resistance 2: $48.8978
- Resistance 1: $47.3288
- Pivot Point: $45.5833
- Support 1: $44.0143
- Support 2: $42.2688
- Support 3: $40.6998
