- MATIC price is primed for another run towards the $1 mark.
- Bulls need to crack this key hurdle to take on the upside once again.
- Polygon wavers in a descending triangle with bullish RSI.
MATIC/USD has stalled its two-day losing streak on Saturday, although the bulls seem to lack follow-through upside momentum, leaving the price confined in a narrow range of around $0.75.
The MATIC price has witnessed some volatility over the past five trading sessions, having failed to find acceptance above the $0.80 psychological barrier.
MATIC/USD: Primed for a big bullish breakout?
After reaching record highs of $1.0278 last month, the MATIC price has reversed a part of the rally, forming lower higher while buyers continue to lurk around the $0.69 region.
This price action has taken a shape of a descending triangle, with a 12-hourly candlestick closing above $0.80 required to confirm an upside break.
That level is the confluence of the falling trendline resistance and mildly bearish 21-simple moving average (SMA).
Doors would then open up for a test of the weekly tops at $0.8382. Only a sustained break about the latter is likely to recall the buyers, as they yearn to recapture the $1 mark.
The relative strength index (RSI) is on a steady decline but holds above the central line, keeping the MATIC bulls hopeful.
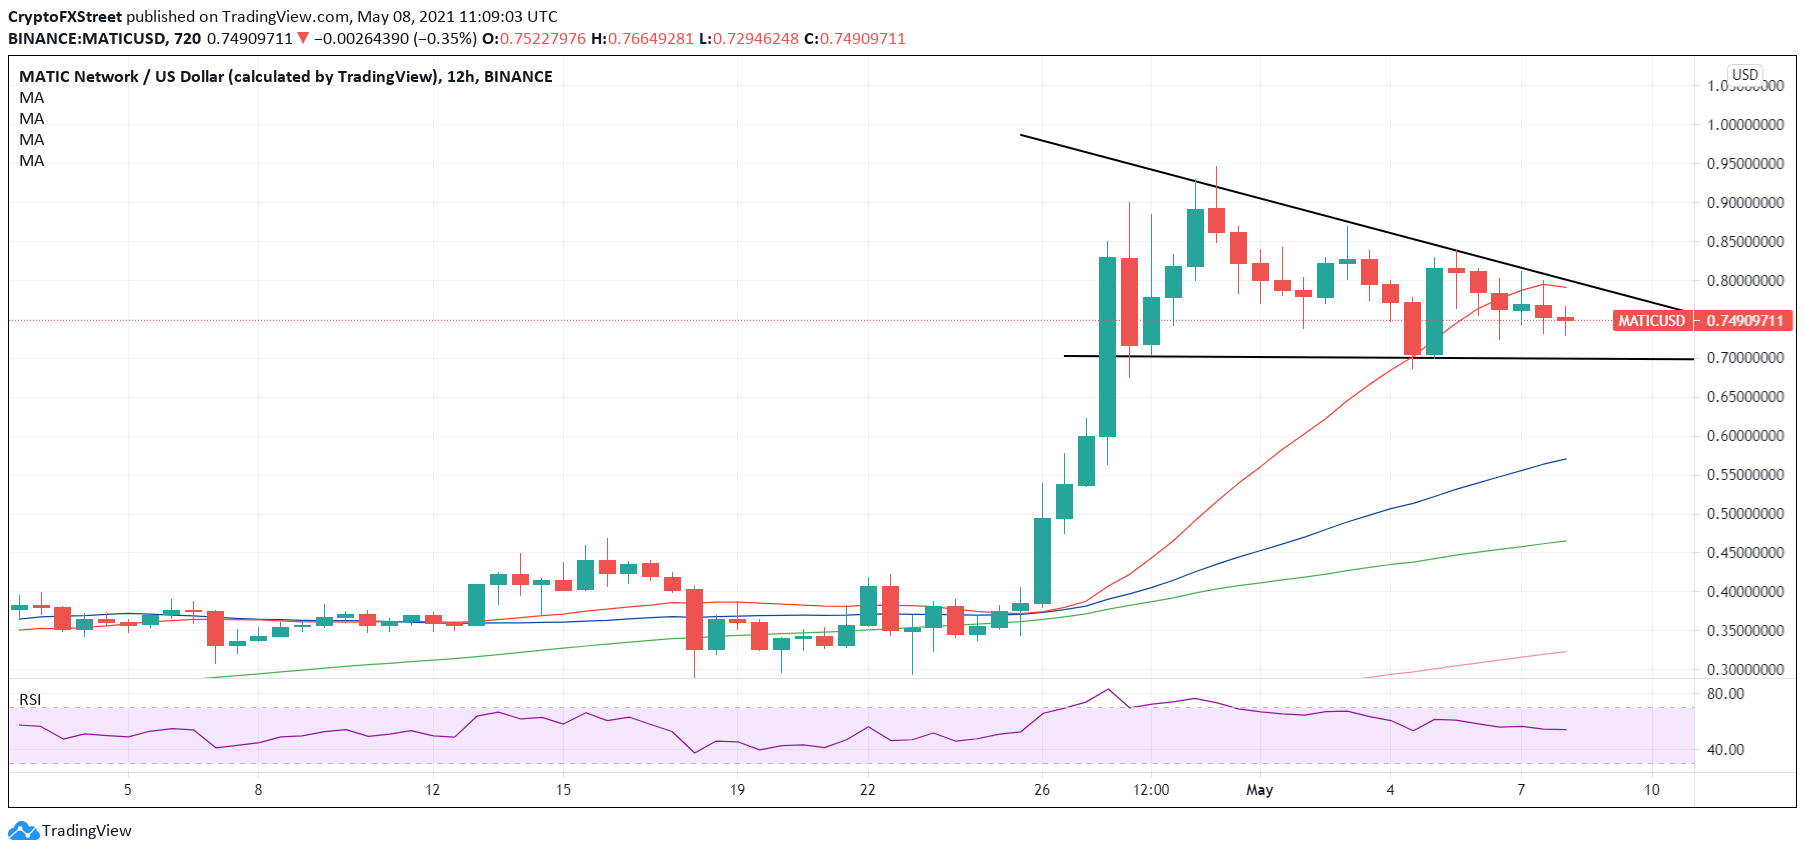
MATIC/USD: 12-hour chart
However, if the price fails to find a footing above the $0.80 powerful resistance, a drop back towards the triangle support at $0.69 cannot be ruled.
A breach of the last would validate a triangle breakdown, which could call for a test of the upward-sloping 50-SMA at $0.5707.
The last line of defense for the MATIC bulls is seen at $0.50, the psychological level.
