- On the 1-hour chart, Polygon has lost a critical support level.
- The digital asset had a breakdown from an ascending parallel channel.
- The long-term momentum has shifted in favor of the bears.
MATIC price had a colossal 44% sell-off in the past week. Although the entire cryptocurrency market faces significant selling pressure, Polygon was one of the most affected coins.
MATIC price could slip even lower
On the 1-hour chart, MATIC formed an ascending parallel channel that can be drawn by connecting the higher highs and higher lows with two parallel trendlines.
The breakdown of this pattern has a bearish price target of $0.347 initially. However, Polygon could fall toward the previous low of $0.32 if bearish momentum remains strong.
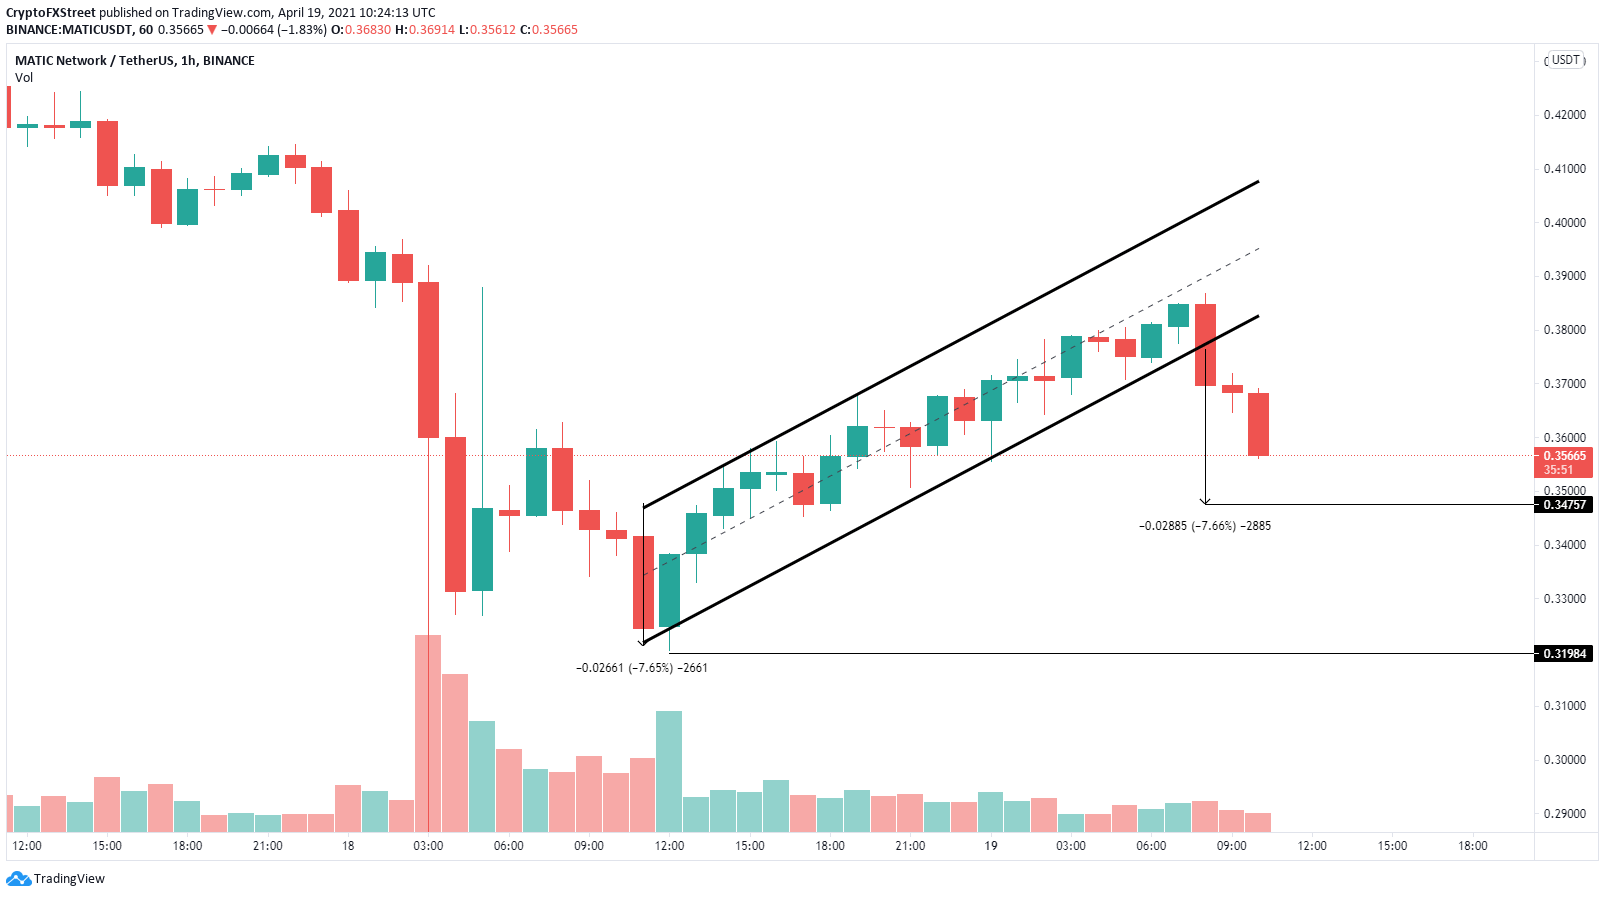
MATIC/USD 1-hour chart
On the other hand, on the daily chart, MATIC price had a breakout from a symmetrical triangle pattern on April 13 and managed to stay above the previous resistance trendline.
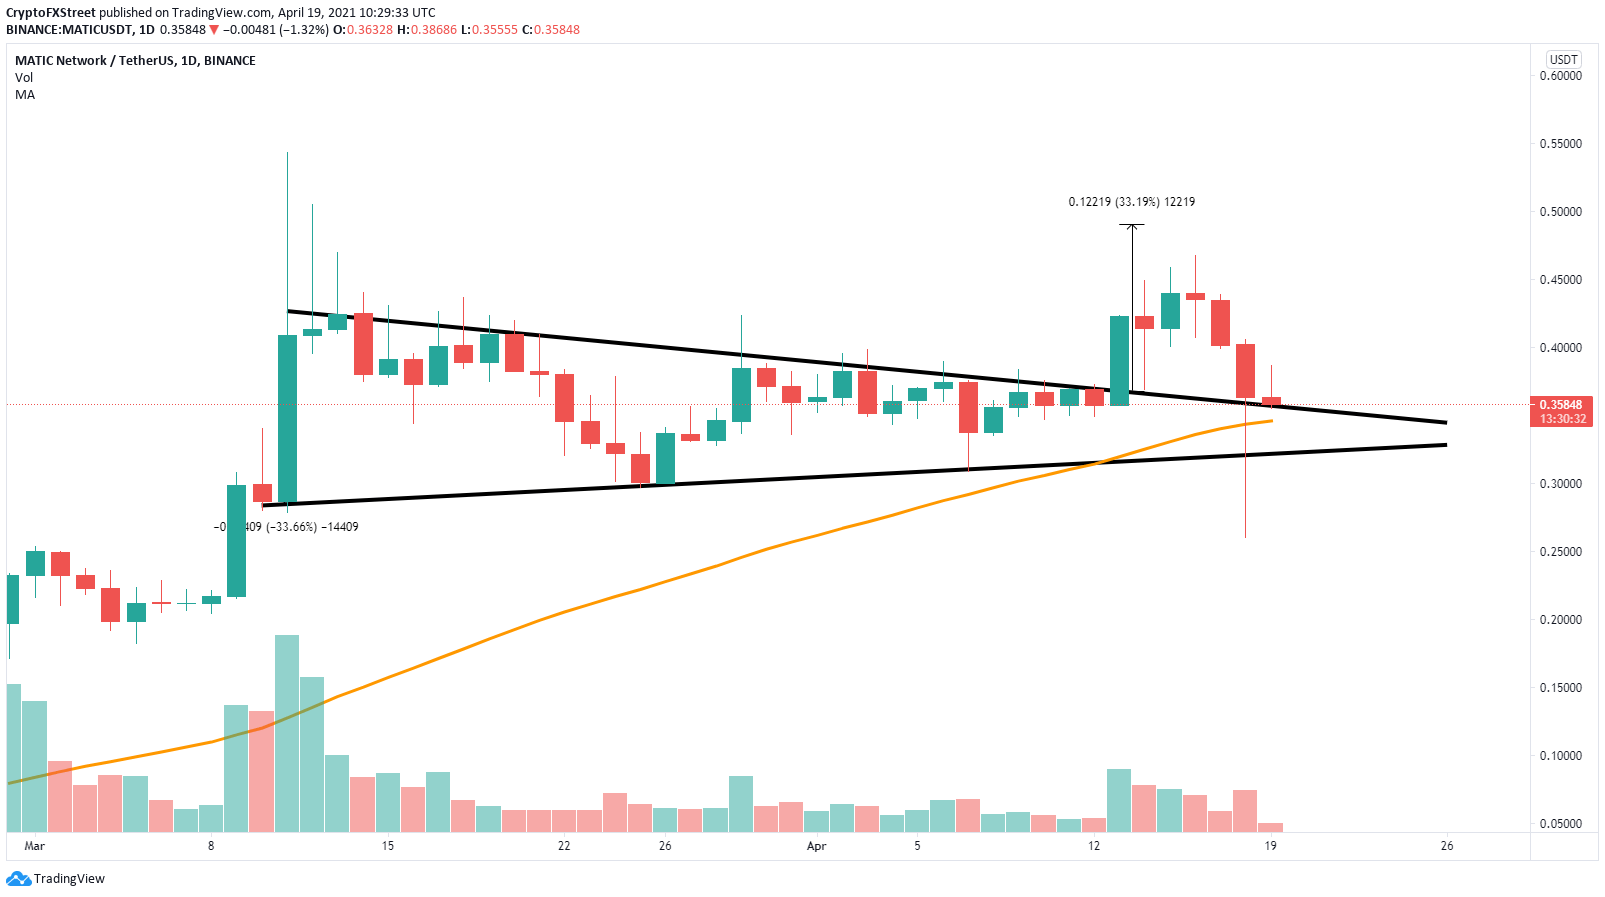
MATIC/USD daily chart
This breakout had a price target of $0.50, and only $0.46 was reached, which means that Polygon could resume its uptrend to hit that target soon.
