- XMR/USD fell from $54.50 to $32.20 this Thursday.
- The RSI has climbed up from 19.20 to 24 following this Friday’s bullish price action.
XMR/USD daily chart
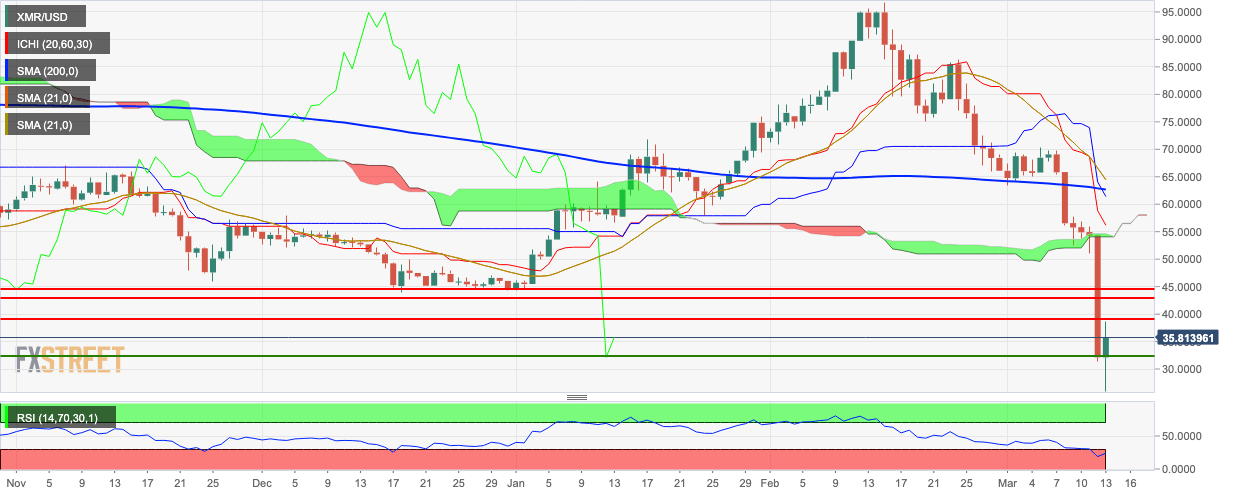
XMR/USD bulls re-entered the market this Friday, taking the price up from $32.20 to $35.20. This followed a heavily bearish Thursday where the price crashed from $54.50 to $32.20, dropping to levels not seen since May 2017. The price is trending below the green Ichimoku cloud, SMA 20, SMA 50 and SMA 200. The RSI indicator has climbed up from 19.20 to 24 following this Friday’s bullish price action.
