- NEO/USD bulls have pushed the price above the 20-day Bollinger Band, showing that it’s presently overvalued.
- The RSI indicator and William’s %R are both trending inside the overbought zone.
NEO/USD daily chart
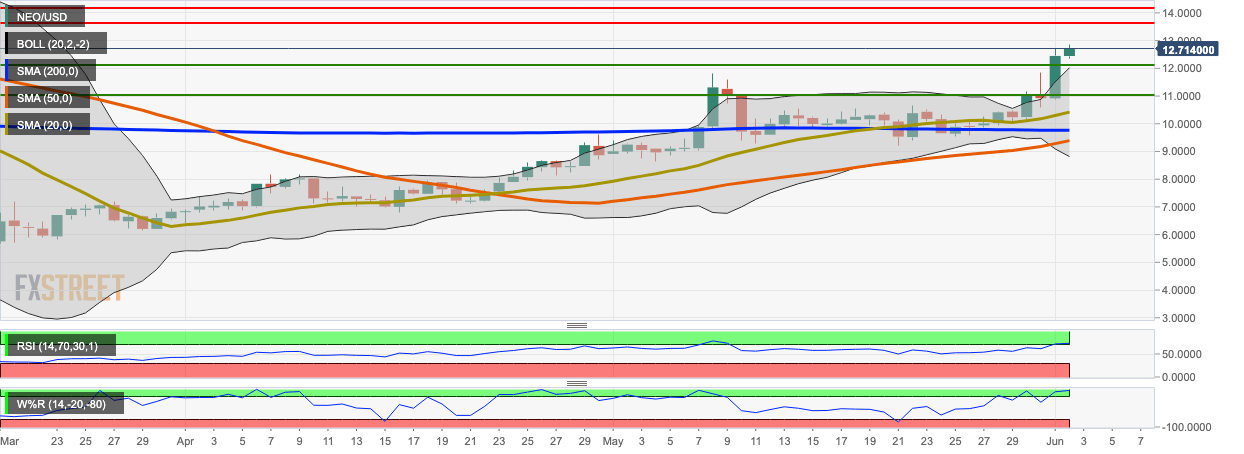
NEO/USD went up from $12.45 to $12.72 in the early hours of Tuesday as the bulls stayed in control for the second straight day. The price has jumped above the 20-day Bollinger Band, indicating that it’s presently overvalued. Both the RSI indicator and William’s %R are trending inside the overbought zone, so a bearish correction is around the corner.
Support and Resistance
NEO/USD faces stiff resistance at $13.64 and $14.21. On the downside, healthy resistance lies at $12.15, $11, SMA 20, SMA 200 and SMA 50.
Key levels
