- NEO/USD went down from $9.14 to $8.78 so far this Tuesday.
- NEO/USD reached a low of $8.06 before bulls stepped back in to push the price up.
NEO/USD is on course of charting two straight bearish days in a row. The asset has gone down from $9.14 to a low of $8.06 this Tuesday, before checking itself to $8.83. This Monday NEO/USD bulls ran out of steam at the $9.30-level and went down to $9.15. The hourly breakdown for Tuesday shows that the price went up to $9.20 and then fell dramatically to $8.75, reaching a low of $8.06. Since then, the bulls stepped back in and took the price back up to $8.83.
NEO/USD daily chart
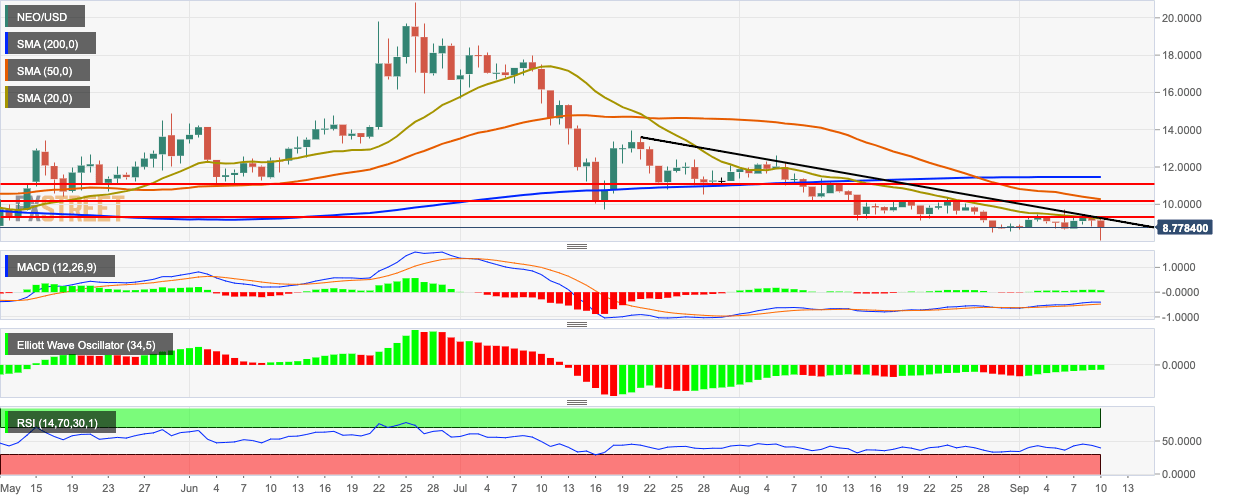
The NEO/USD price has found resistance at the downward trending line and the 20-day simple moving average (SMA 20) curve. The price is also trending below the SMA 50 and SMA 200 curves. The moving average convergence/divergence (MACD) indicator shows slight bullish momentum. The Elliott oscillator shows nine straight bullish sessions and the relative strength index (RSI) indicator has dropped from 46.85 to 40.50.
