- NEO/USD fell from $11.25 to $11.05 this Tuesday.
- The market has found support on the SMA 200 curve.
NEO/USD is currently consolidating in a flag formation. This Tuesday, the bears took over and pushed the price down from $11.25 to $11.05. The hourly chart shows that the price went up to $11.40, where it met resistance and fell to $11.10. The price then bounced back up to $11.35, where the hourly price met resistance again and fell to $11.05.
NEO/USD daily chart
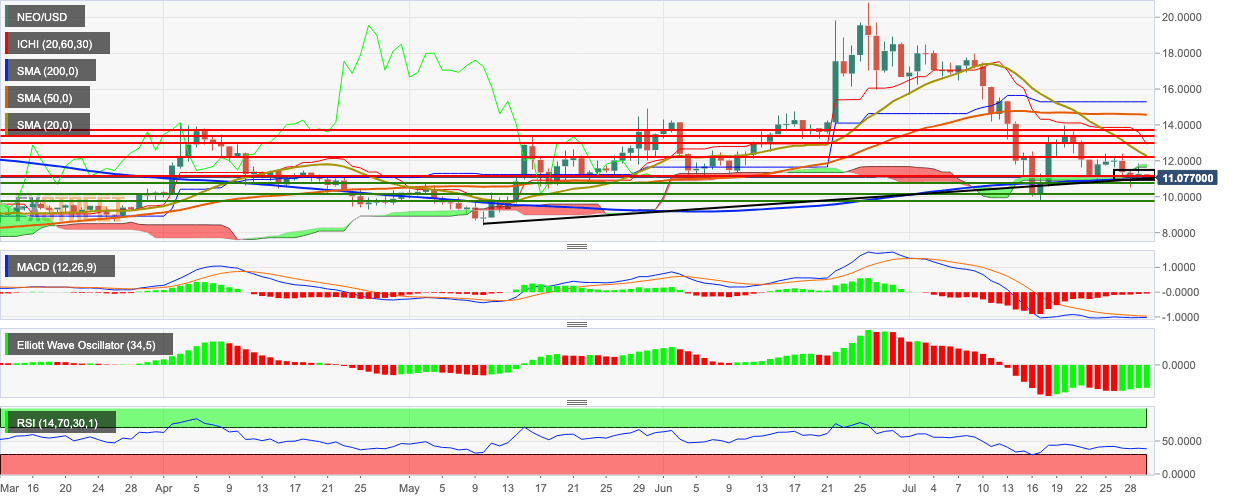
The NEO/USD hourly chart has found support on the 200-day simple moving average (SMA 200) curve and is trending below both the SMA 50 an SMA 20 curve. The price had a bearish breakout from the green Ichimoku cloud. The moving average convergence/divergence (MACD) indicator shows decreasing market momentum. The Elliot oscillator shows four straight bullish sessions of increasing intensity. The relative strength index (RSI) indicator is trending around 39, next to the oversold zone.
