- The bullish trend has turned bearish on failure to break $35.00 key resistance.
- NEO price is trading between the moving average support and resistance at $33.58 and $35.58.
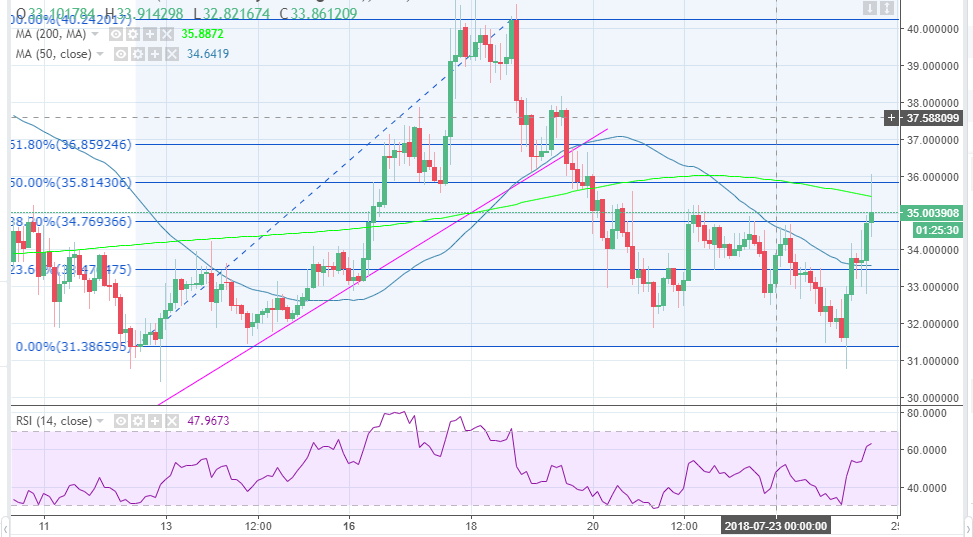
NEO has spiked again jumping over 7% on Tuesday. Moreover, NEO/USD is retesting the key resistance at $35.00, but the 38.2% Fibonacci retracement level with the last swing high of $40.24 and a low of $31.38 at $34.77 is offering immediate resistance. There is a bullish trend on the charts, however, various technical indicators are sending bearish signals for the near-term.
The price is also trading between the moving averages support and resistance on the 2-hour chart. The 50 SMA is supporting the bullish trend at $33.58, on the other hand, the longer term 200 SMA is limiting movement to the upside at $35.44. NEO/USD is, however, still range bound below $35.00 besides, the key resistance is at $36.00 and $38.00 supply zones.
The Relative Strength Index is currently bending downwards to confirm the bear reaction on the chart. The MACD is ranging at the 0.0000 mark after recovering from the negative territory. NEO must find a support above $34.00 to stay away from more declines. If the 50 SMA gives in to selling pressure, the 23.6% Fib retracement level at $33.47 will be very instrumental in preventing more losses.
NEO/USD 2-hour chart