- NEO price upside restricted within the classic rising wedge pattern; still at risk of more declines.
- The trendline coincides with the 50 SMA to offer support above $34.50.
NEO price is forming a classic rising wedge pattern seen on the 15-minutes chart. However, as explored in the previous analysis, the price is still locked below the stubborn resistance at $35.5, despite the breakout during the Asian trading hours on Thursday. NEO opened the trading session at $32.142, there was a struggle at $34.50, but after that, a spike occurred trading above $35.00, although the trend lost momentum at $35.50.
Technical indicators are sending bearish signals, at the moment, NEO price is seeking support at $35.00. A break down is also imminent especially if the price fails to break out of the rising wedge pattern. The zone at $35.50 is a breakout point in the short. It is vital that NEO/USD breaks above this level and finds a higher support to allow it to recoil towards the medium-term key support area $40.00. On the downside, the trendline coincides with the 50 SMA to offer support above $34.50 (previous resistance).
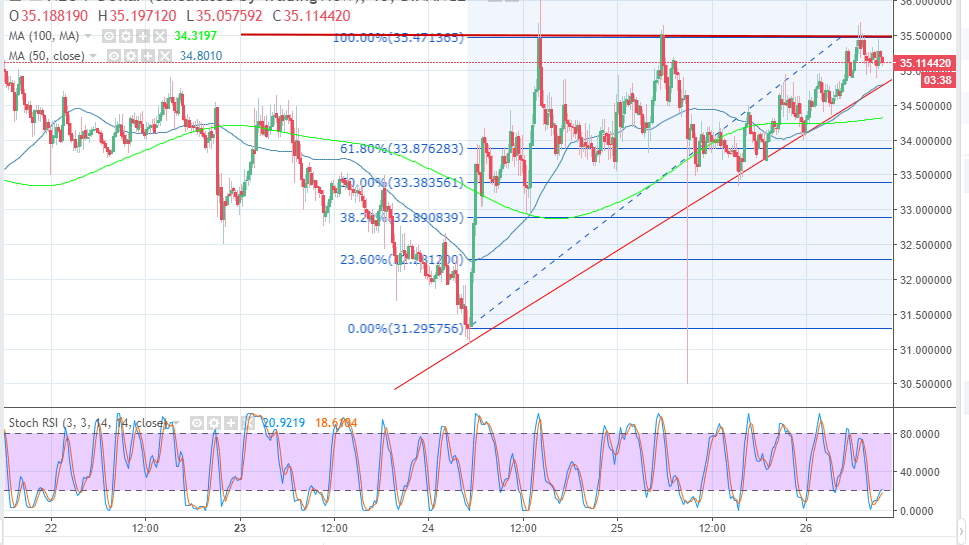
NEO price declined yesterday and tested the support at the 50% Fib retracement level with the last swing high of $35.47 and a swing low of $31.29 marginally below $33.50. It is clear that failure to clear the resistance at $35.50 is resulting in frequent price drops mainly supported above $33.00.
NEO/USD 15-minutes chart