- NEO/USD is trading 14.32% higher on Monday as bulls continue to be in control.
- There is a key resistance zone coming up beyond the 13.00 level.
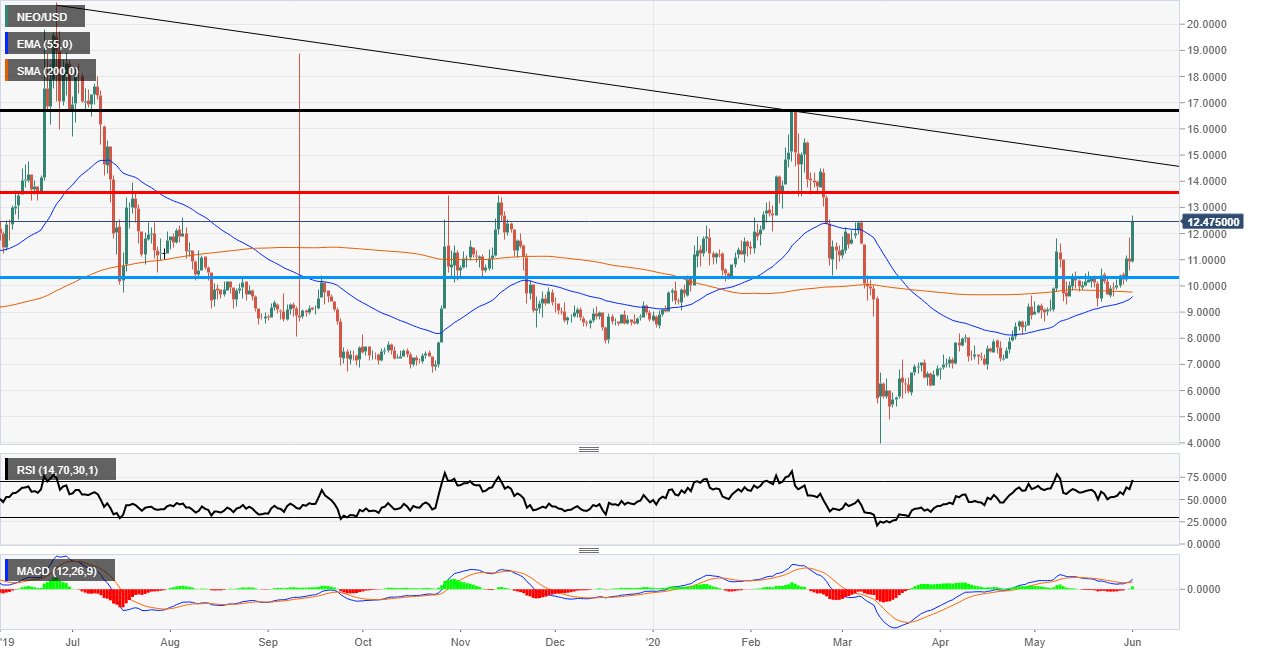
NEO/USD daily chart
Neo is one of the major outperformers on Monday as the price has risen over 14% on the session. The psychological 13.00 is the next target after 12.00 was broken with ease in the EU session.
Looking at the daily chart, the next major resistance is on the red horizontal line at 13.4450. This level has been used many times as both support and resistance but between October and December 2019 there was a sell-off at the zone.
The Relative Strength Index indicator has moved into overbought territory which could mean there is a pullback in the short term. The MACD histogram has moved above the zero line and the signal lines are both above the mid-point which is bullish. Lastly, the two key moving averages (55 & 200) are about to have a bullish cross. So all in all all signals are go for NEO.