- Before this Saturday, NEO/USD had risen from $13.55 to $16.69 over the previous four days.
- The RSI has dipped from 82 to 75.
NEO/USD daily chart
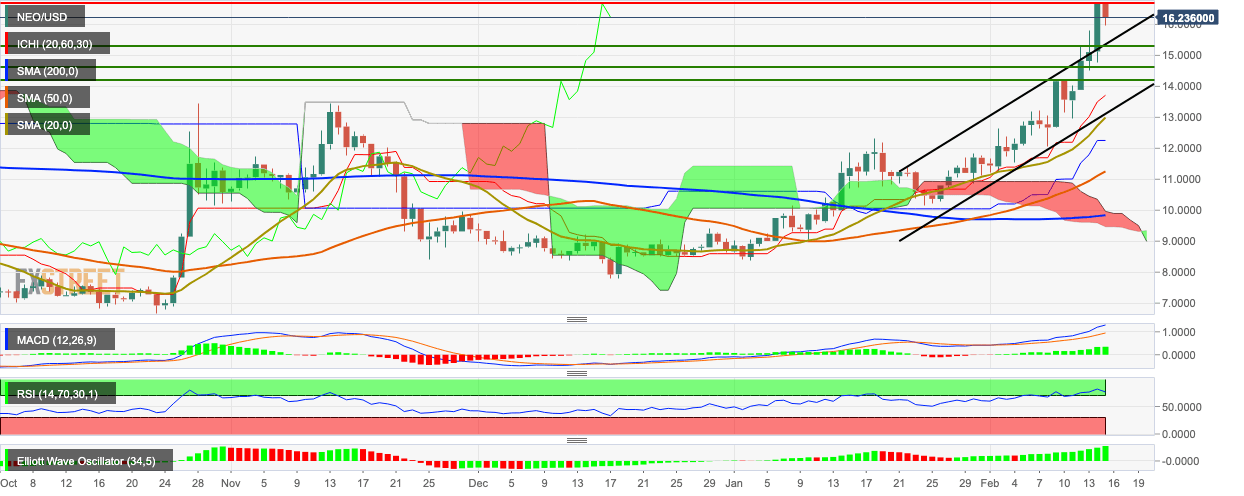
NEO/USD ran out of steam around the $16.70 level as the price dipped from $16.69 to $16.10 in the early hours of Saturday. Before this, NEO/USD had four straight bullish days wherein the price spiked from $13.55 to $16.69. While the RSI indicator has dipped from 82 to 75, it is still hovering inside the overbought zone. This shows that a further price drop may be expected. Since the next healthy support level is at $15.32, the bulls will need to get their act together and make sure that the NEO/USD doesn’t slide any further than it already has.
