- The MACD indicator shows increasing bearish momentum.
- The Elliott Oscillator has had three consecutive red sessions.
NEO/USD is about to chart its third straight bearish day. Over this period, NEO/USD fell from $12.40 to $11.24. The latest session is sandwiched between the 20-day Simple Moving Average (SMA 20) on the upside and the SMA 200 on the downside. Before this, NEO/USD had enjoyed a steady rise following Chinese President Xi Jinping’s positive comments on the blockchain technology.
NEO/USD daily chart
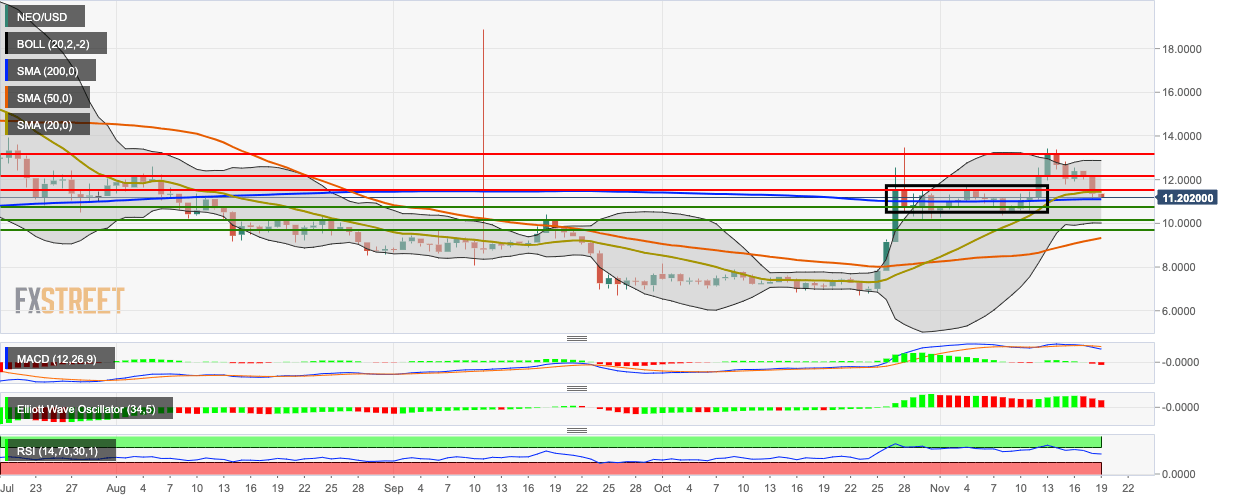
The 20-day Bollinger jaw has narrowed, indicating decreasing market volatility, while the Moving Average Convergence/Divergence (MACD) indicates decreasing bearish momentum. The Elliott Oscillator has had three consecutive red sessions and the Relative Strength Index (RSI) indicator is trending around 54.05.
