- The Elliott Oscillator has had 21 straight green sessions, indicating sustained bullish sentiment.
- The 20-day Bollinger Band has narrowed, hinting at decreasing price volatility.
NEO/USD daily chart
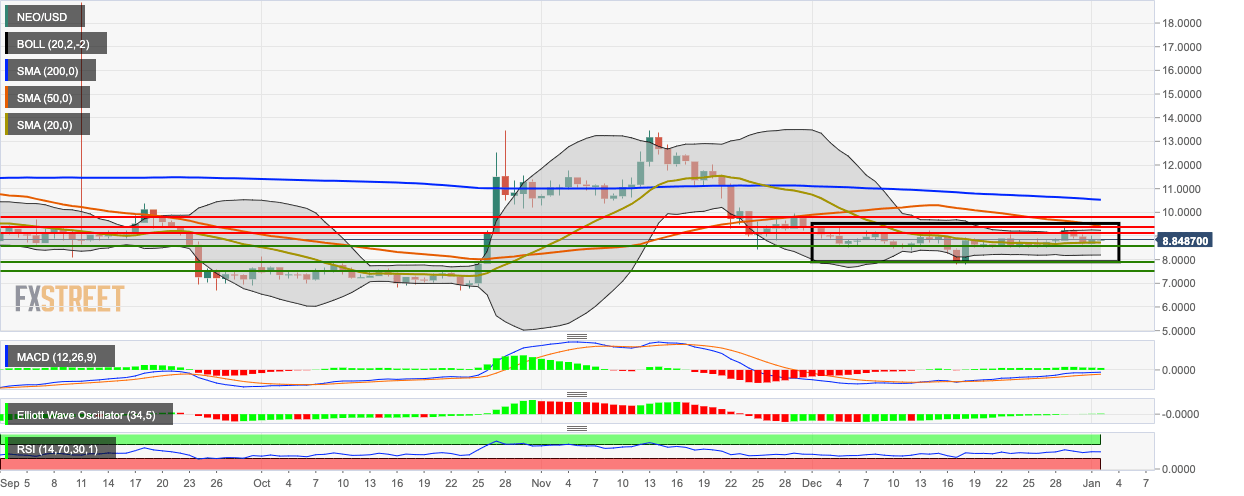
NEO/USD is trading for $8.84 after a bullish Wednesday, which saw its price rise from $8.67 to $8.87. The 20-day Simple Moving Average (SMA 20) acts as immediate market support, while SMA 50 acts as resistance. The 20-day Bollinger Band has narrowed, hinting at decreasing market volatility. The Elliott Oscillator has had 21 straight green sessions indicating sustained bullish sentiment, while the Moving Average Convergence/Divergence (MACD) indicates increasing bullish momentum.
