- NEO gave a false breakout on the long term charts.
- Shorter term shows downard momentum continuing.
NEO the cryptocurrency, gave a false breakout earlier this week only to get back to its southward journey that started earlier this year along with all the other major cryptocurrencies. This time, though, the difference is that NEO has more pain left compared to many other major ones.
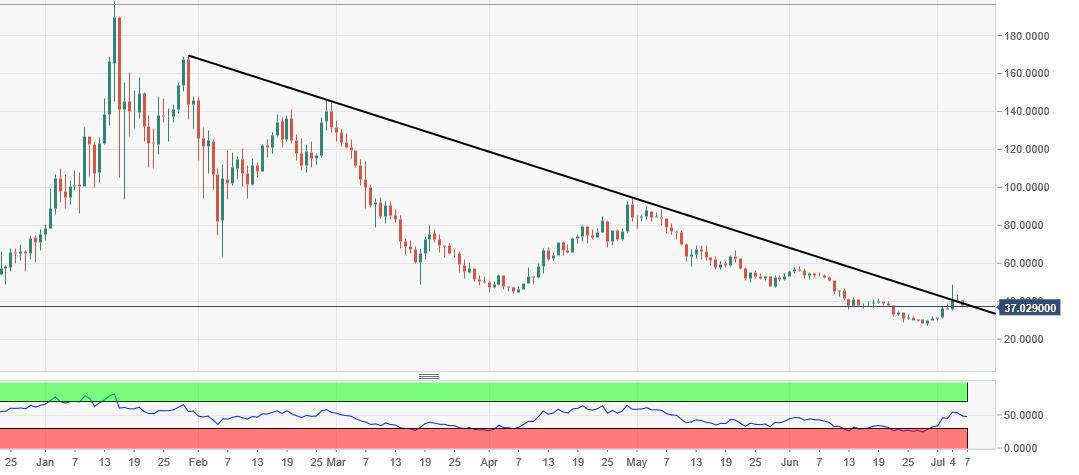
NEO/USD trading is 1 percent lower in the Saturday trading at $37.12 and in a narrow band of less than 3 percent for the day. On the daily charts, NEO broke out of a long term descending trendline earlier on Wednesday, only to again fall back below it the very next day.
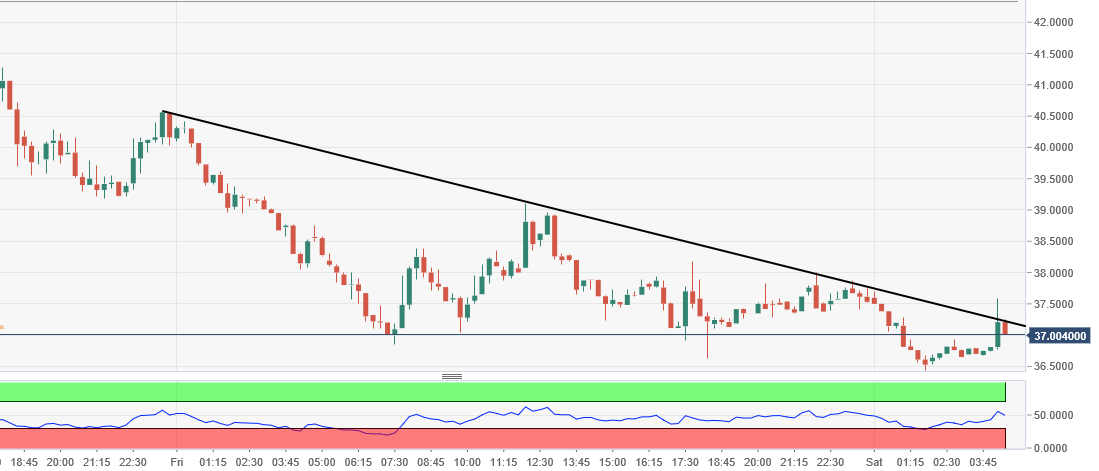
To add salt to the injury, on the 15-minute chart, NEO is facing resistance in the form of a descending trendline and has been flirting with it through the day, facing selling price everytime it tries to cross it.
NEO/USD daily chart:
NEO/USD 15-minute chart: