- NEO price drops 8% to seek support at the 200-day SMA.
- Neo short-term price prediction is bearish as validated by several technical indicators.
- A decisive breakout above $60 would bolster bulls to re-start the bullish leg.
Neo price has had an impressive 153% rally from the July 20 low at $25.15 to the August 24 three-month high at $62.90 according to historical data from Coinmarketcap. This rally saw NEO shatter major hurdles such as the 50, 100, and 200 Simple Moving Averages (SMA), and the $37.80 and $47.0 major resistances.
However, the Neo price action has remained largely choppy over the last 10 days with now clear direction of where the asset is going. At the moment, NEO looks bearish as attempts to push past the $60 mark have been repeatedly curtailed. This has seen Neo price bulls retreat to seek safe haven above the 200-day SMA at $53.36.
Neo Price Must Hold Above The 200 SMA
The Neo price prediction is neutral as it is not clear at the moment where the market is headed to. However, it is worth noting that NEO bulls must defend the immediate support at $53.36 embraced by the 200-day SMA. If this support doesn’t hold and NEO closes the day below this point, things could go awry for the asset with a correction towards the $50 psychological and $47 support levels in the offing.
A further drop downwards would see the Neo bulls retreat to re-test the $40 and $41.80 support levels embraced by the 100 and the 50 SMAs respectively, as shown on the daily chart.
- Check out our guide for credible crypto signals.
NEO/USD Daily Chart
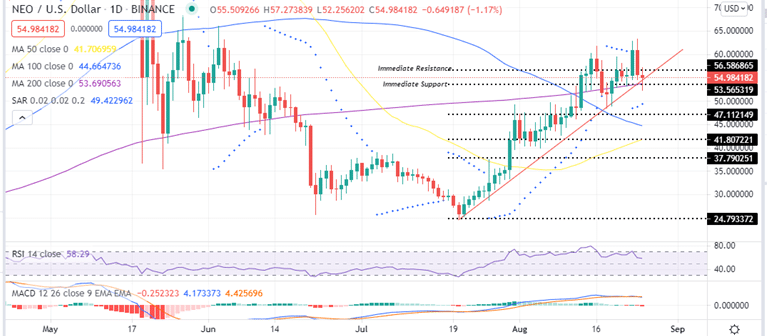
NEO’s bearish narrative is validated by the downward movement of the Relative Strength Index (RSI) indicator away from the overbought zone indicating that bears are in control.
It is also worth noting that the Moving Average Divergence Convergence (MACD) indicator sent a call to sell signal yesterday August 24 on the daily chart. This occurred when the MACD line (blue) crossed below the signal line (orange) adding credence to the bearish narrative.
Looking Over the Fence
Note that if the market moves in favour of bulls, they should target overcoming the immediate resistance at the $56.58 level. A daily close above this level could bolster bulls to push the price to towards the $60 psychological level and even test the June 03 high above $65.
Note that several technical elements support this bullish outlook. . First, Neo is trading above the 200,100 and 50 SMAs which turned from resistance into support following the rally that started July 21.
Second, the Moving Average Convergence Divergence (MACD) indicator is positioned in the positive region above the zero line which favours the bullish bias.
Third, NEO is trading above the July rising trendline (red line). As long as Neo price does not fall below the rising trendline, the odds of a breakout above $60 are heightened.
Given these three solid reasons, Neo buyers might want to step into the rally.
At the time of writing, NEO teeters at $54.95.
Where to Buy NEO
The top exchanges for trading in NEO currently are: eToro, Bittrex and Binance. You can find others listed on our crypto exchanges page.
Looking to buy or trade NEO now? Invest at eToro!
Capital at risk
