Home NEO Technical Analysis: NEO/USD price gets tighter within the bears paws on Friday, however managing to find support within strong touted demand zone
Crypto News

NEO Technical Analysis: NEO/USD price gets tighter within the bears paws on Friday, however managing to find support within strong touted demand zone

  • NEO price lose ground on Friday, seen down around 2% in the latter stages of trading.
  • NEO/USD managed to receive a decent boost from a touted demand zone and the 61.8% Fibonacci seen at $51.81, session lows.
  • On the weekly, NEO/USD is set to close another week in the red, as seen across the other altcoins.


NEO/USD 60-minute chart
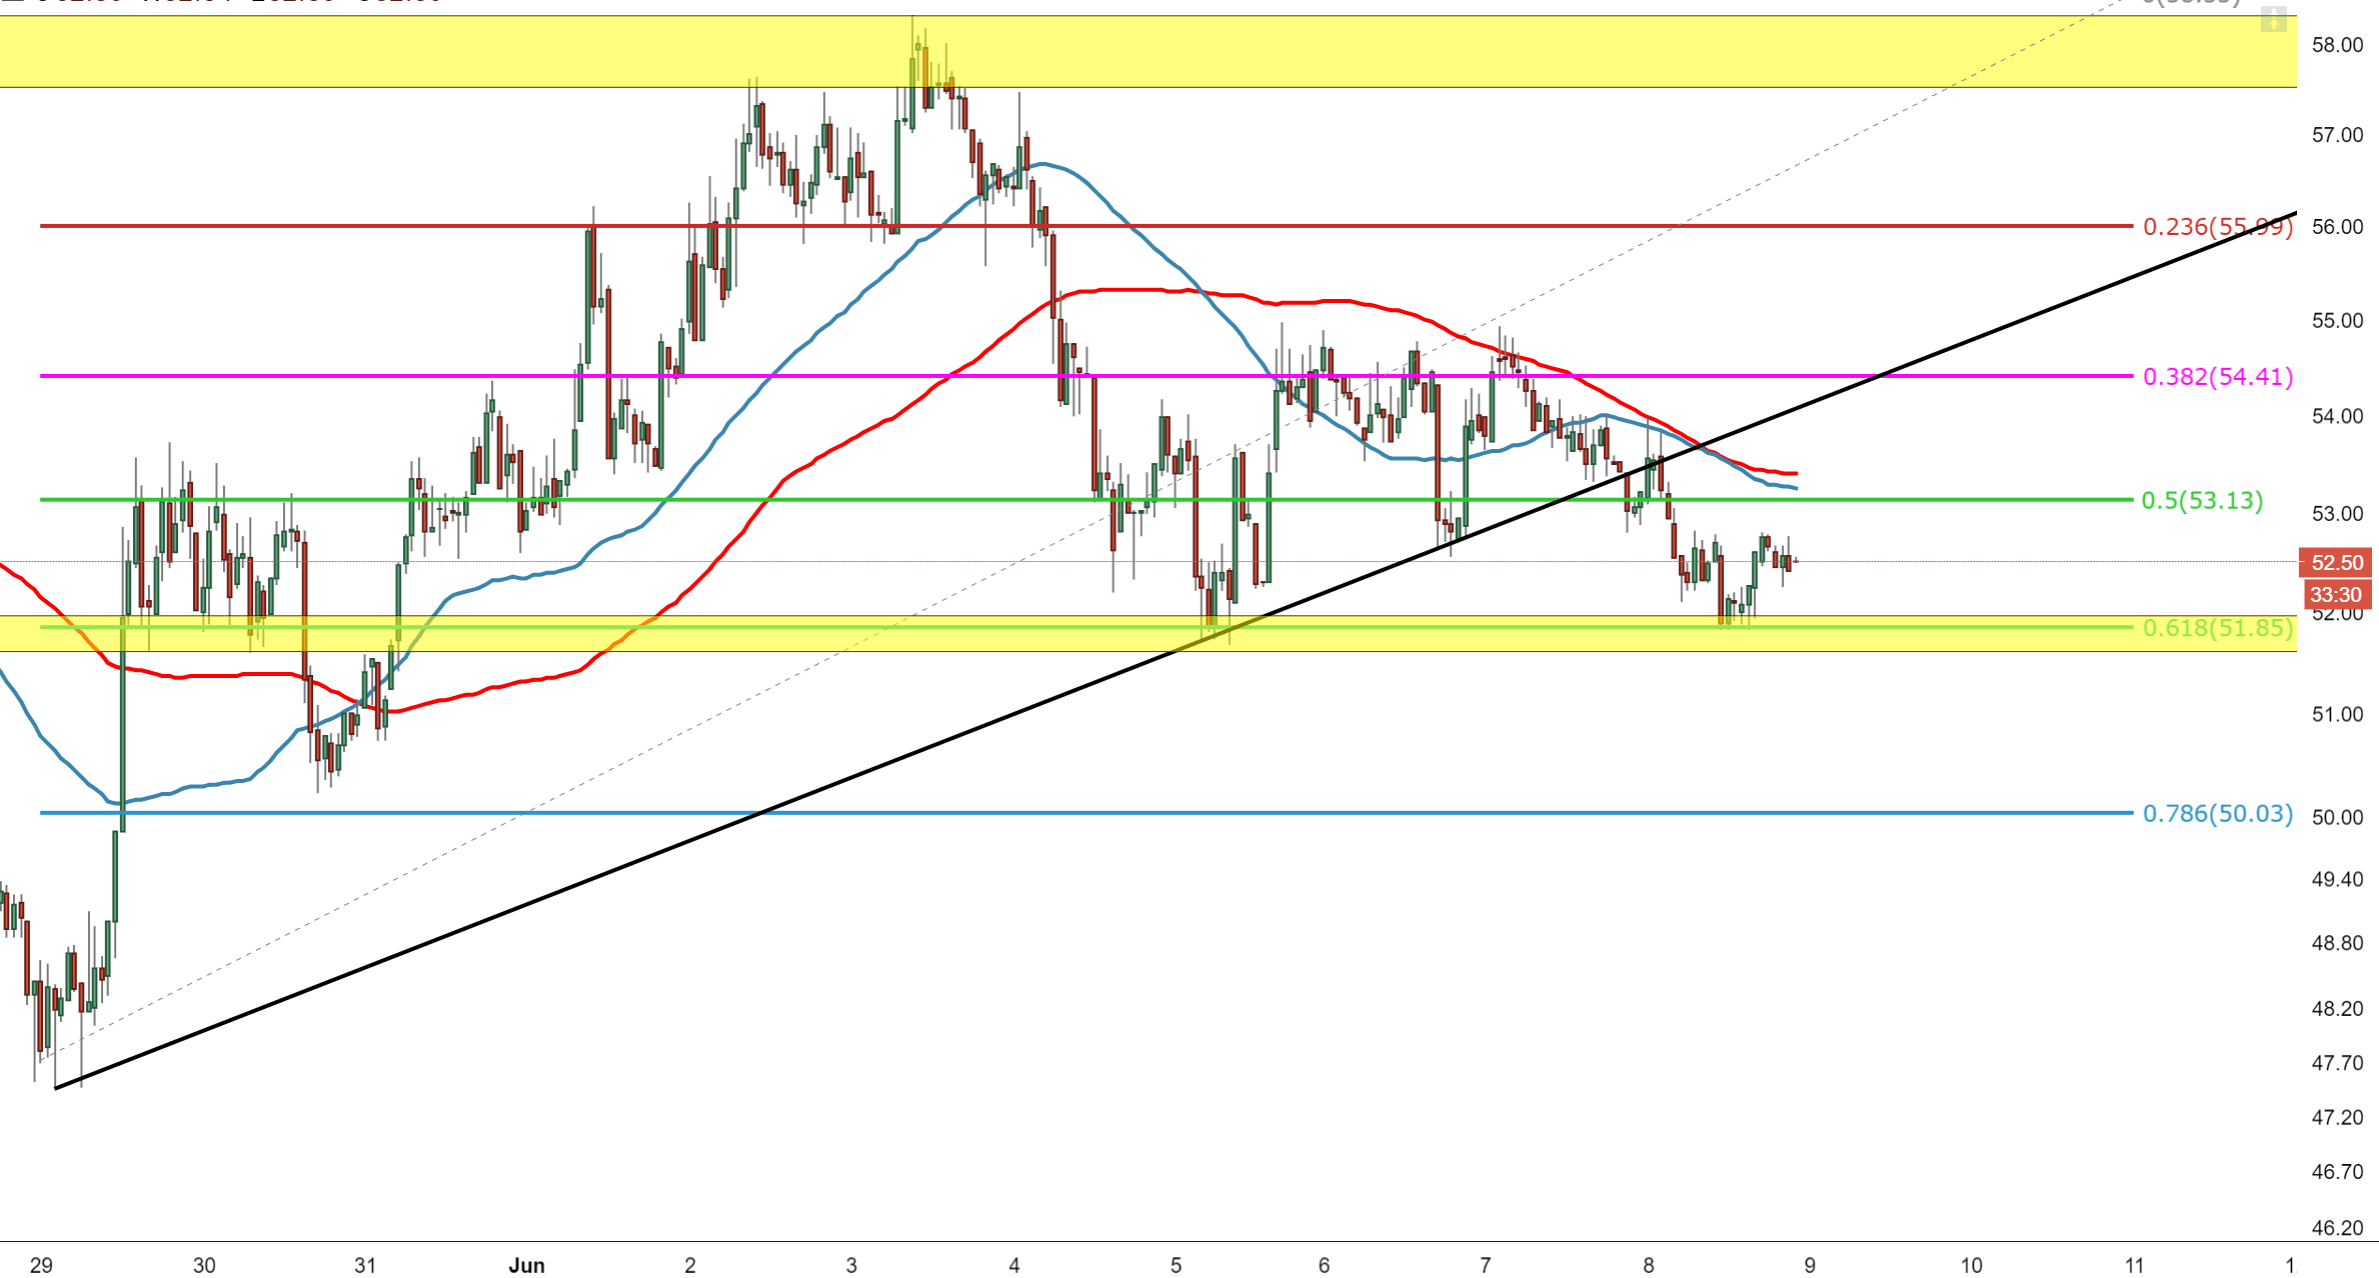
Spot rate:                                      55.51

Relative change:               -1.95%

High:                              53.82

Low:                              51.81


Trend:                                                 Bearish


Support 1:                                   51.81, today’s (Friday) low & 61.8% Fibonacci.

Support 2:                                     50.26, 30th May low.

Support 3:                                     48.63, 28th May low.

Resistance 1:                           53.10, 50% Fibonacci.

Resistance 2:                           53.24, 50MA.

Resistance 3:                           54.17, above ascending trend line.


FX Street

FX Street

FXStreet is the leading independent portal dedicated to the Foreign Exchange (Forex) market. It was launched in 2000 and the portal has always been proud of their unyielding commitment to provide objective and unbiased information, to enable their users to take better and more confident decisions.