- NEO is one of the weakest across the crypto space on Sunday.
- Technical setup remains in favor of bears, points to further losses.
NEO (NEO/USD), emerges as one of the biggest losers among the top 20 digital currencies traded, losing 3.30% on the day and 21+% over the last seven days. The coin has resumed its recent bearish following a brief bounce seen on Saturday, as the bulls fail to sustain above the 10.00 threshold, tracking a down day across the crypto board. Despite the steep losses, NEO enjoys a market capitalization of $ 686 million.
NEO/USD 15-minutes chart
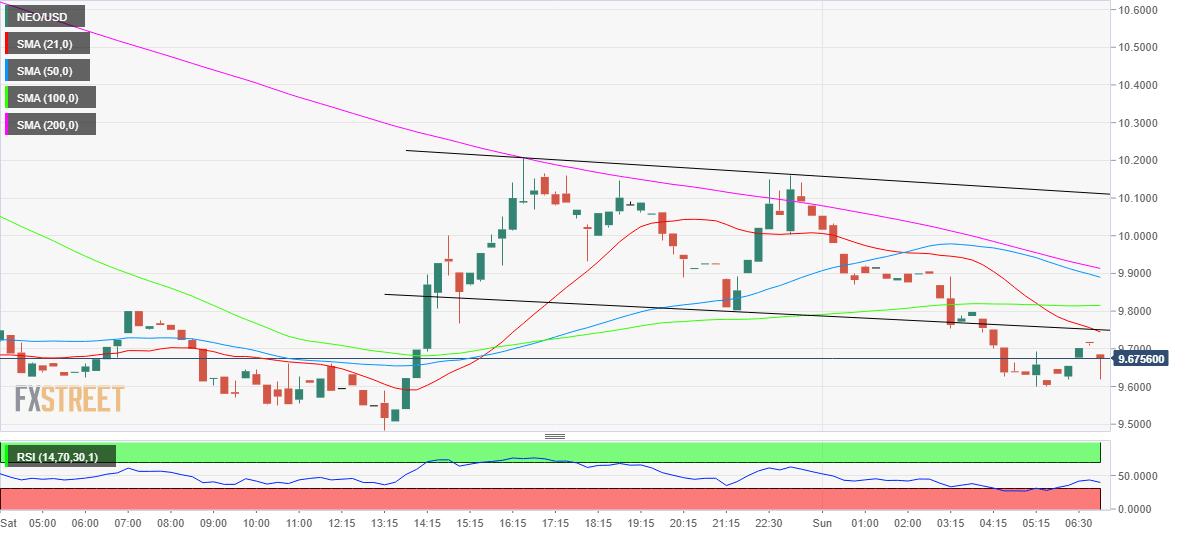
- Sellers fight back control after falling channel breakdown confirmed.
- The pattern target lies at 9.30, a break below which 9.20 demand zone will be tested.
- Bulls to face initial rejection near 9.75, the intersection of bearish 21-SMA and pattern support-now-turned resistance.
- Next resistances await at the horizontal 100-SMA at 9.81 and 10.00 (round figure).
NEO/USD daily chart
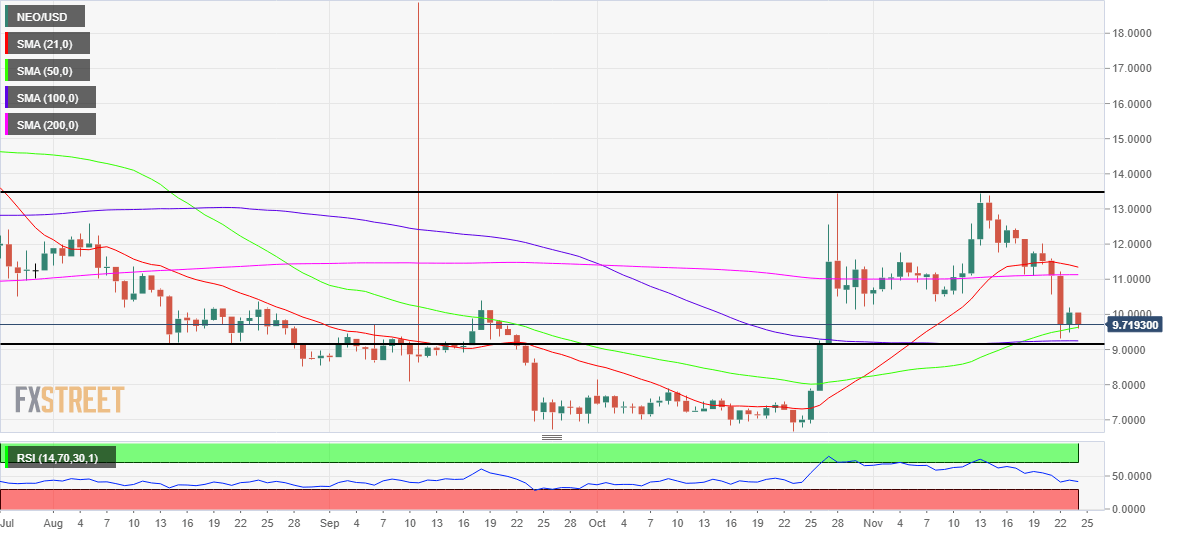
- Range play intact within a potential rectangle or horizontal channel formation.
- Strong support is aligned at 9.25/15, the confluence of channel support and flat 100-DMA.
- The pattern to get confirmed if the price yields a daily closing below the said support.
- A breach of the last could accentuate the downside, leading to a test of sub-6.00 levels by end-December.
- The immediate upside looks capped by 10.00, with the next resistance now seen at a horizontal 200-DMA of 11.13.
NEO/USD Levels to watch
