- NEO breaks down of a triangle in short term.
- Golden cross occurs in the long term, might help.
NEO, the coin that is still 95 percent below its all time high, is facing a typical situation wherein it has broken down of a key triangle formation in the short term even as bullish golden cross has occured in the long term.
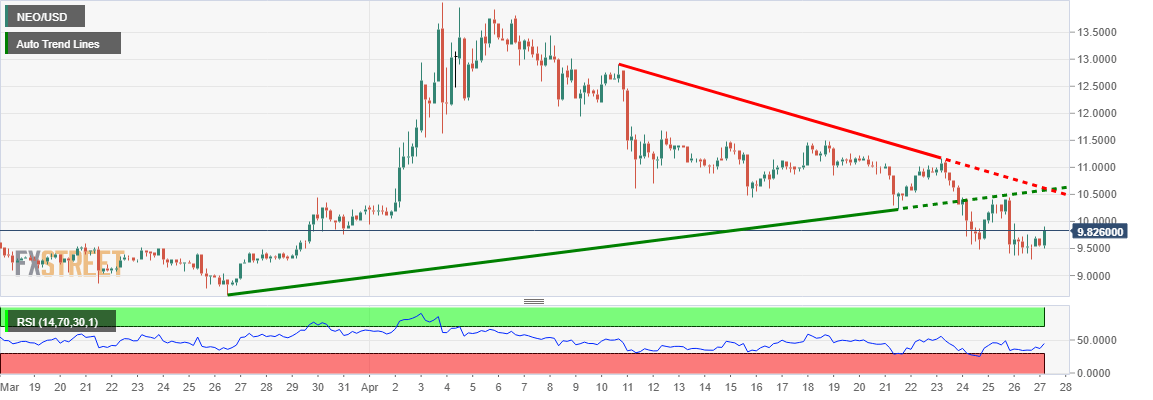
NEO/USD is up nearly 2 percent on day at $9.85, around high point of the day and in a good 4 percent range on Saturday. On the 240-minute chart, earlier this week, the coin broke down of a triangle pattern which is bearish in the short term and has targets all the way towards $6.5.
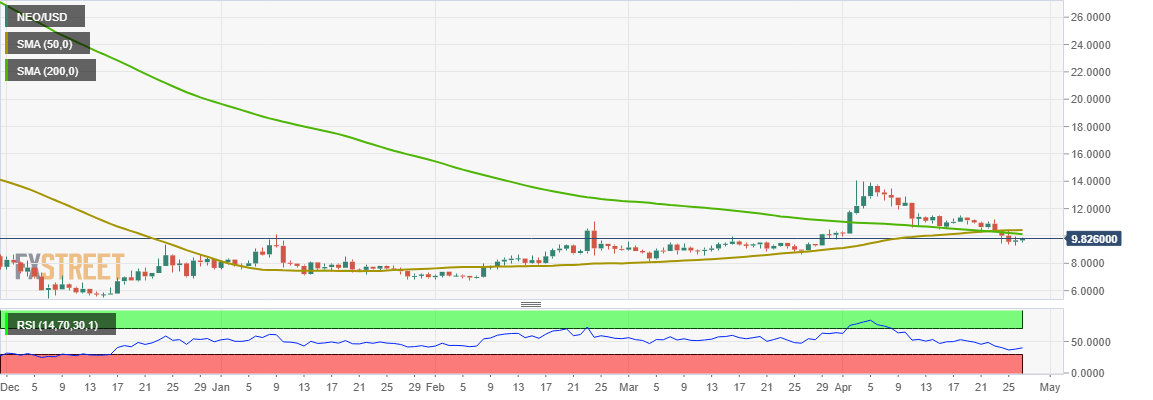
However, bulls would like to pin their hopes on the bullish golden cross of the daily chart, even as the price has fallen below the 200 days SMA for now, a bounce with hopes to cross past the crossover point would be eyed.
NEO/USD 240-minute chart:
NEO/USD daily chart: