- NEO/USD went down from $9.01 to $8.86 this Tuesday.
- Bulls need to defend support at $8.35.
NEO/USD bears dominated the daily market for the third session in a row. Over these sessions, NEO/USD had gone down from $9.50 to $8.86 with the price going down from $9.01 to $8.86 this Tuesday. If the bulls want to reverse this trend, then they will need to defend support at $8.35.
NEO/USD daily chart
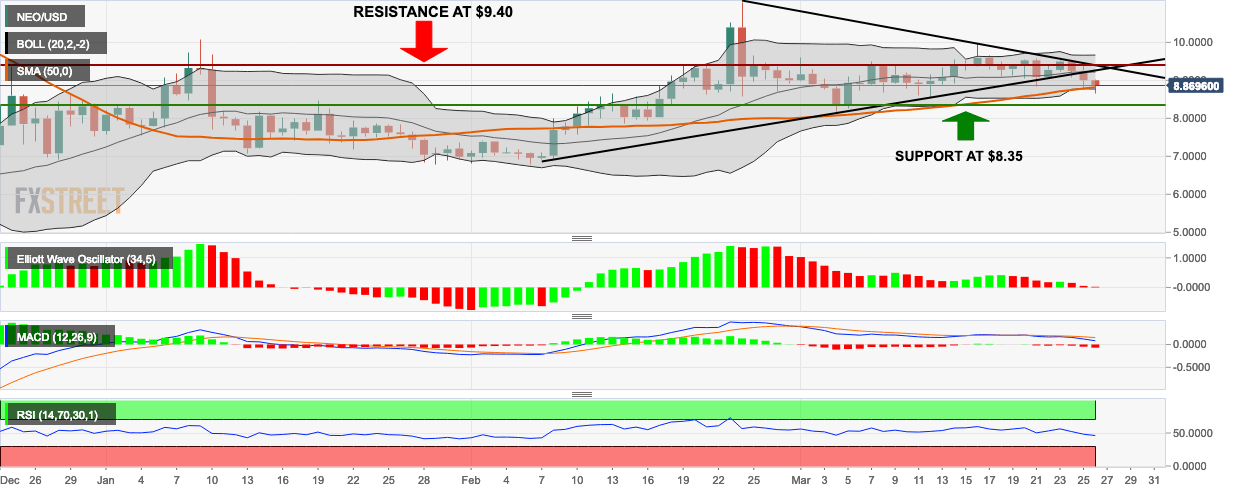
The market has had a bearish breakout from the triangle formation over the last two sessions. The last session, in particular, has been extremely bearish for the following two reasons:
- The price has pierced the lower band of the 20-day Bollinger band.
- The price has also gone below the 50-day simple moving average (SMA 50) curve.
Both of these are bearish signs. The following indicators also show the overall bearishness of the market:
- Six out of the last seven sessions in the Elliot wave oscillator indicates that the overall market sentiment is bearish.
- The moving average convergence divergence (MACD) indicator shows that the signal line is diverging away from the MACD line, which shows increasing bearish momentum.
- The relative strength index (RSI) curve is dipping towards the oversold territory.
