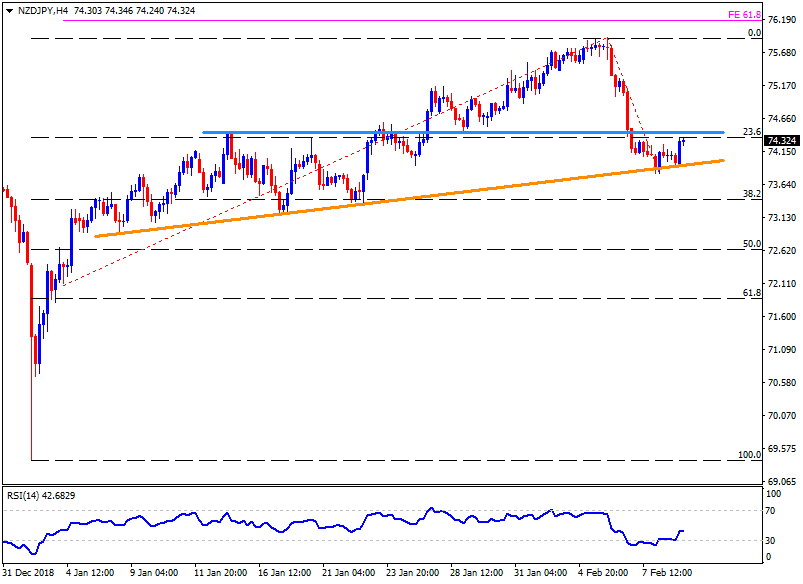
- The NZD/JPY pair again bounced off the month-long support-line during early Monday and is presently rising towards 74.45-50 resistance-area.
- During the pair’s extended up moves past-74.50, 74.70. 75.15 and 75.55 may offer intermediate halts during its rally to 75.90.
- In case prices slip under 73.90 support-line then the sellers can aim for 38.2% Fibonacci retracement of its recent surge, around 73.40.
- Assuming the Bears capacity to rule after 73.40, 72.90 and 72.40 may become their favorites.
- While gradually recovering 14-bar relative strength index (RSI) signal the pair’s rise, successful break of 74.50 seem prerequisite to justify the strength of momentum.
NZD/JPY 4-Hour chart
Overview:
Today Last Price: 74.34
Today Daily change: 23 pips
Today Daily change %: 0.31%
Today Daily Open: 74.11
Trends:
Daily SMA20: 74.54
Daily SMA50: 75.07
Daily SMA100: 75.12
Daily SMA200: 75.17
Levels:
Previous Daily High: 74.28
Previous Daily Low: 73.82
Previous Weekly High: 75.93
Previous Weekly Low: 73.82
Previous Monthly High: 75.54
Previous Monthly Low: 68.2
Daily Fibonacci 38.2%: 74
Daily Fibonacci 61.8%: 74.11
Daily Pivot Point S1: 73.86
Daily Pivot Point S2: 73.61
Daily Pivot Point S3: 73.39
Daily Pivot Point R1: 74.32
Daily Pivot Point R2: 74.53
Daily Pivot Point R3: 74.78
