- The daily candlesticks show price struggling through the 76.4% Fibo of the early Dec to Jan flash crash lows – located at the swing fractal high of 76.54.
- NZD/JPY is close to a test of the descending trend line resistance confluence with the 4hr 21 SMA, capped currently by the 21-hr SMA.
- Meanwhile, USD/JPY is heading for a test into the Ichimuko cloud on an hourly basis and a break below 110.75 will pressure the NZD/JPY cross towards S3 at 75.60. A break of the cloud support at 110.55 will likely attract Japanese sellers into the mix and squeeze NZD/JPY even lower for a test f the 61.8% Fibo confluence with a cluster of the 21-D SMA, 200-D SMA and 100-D SMA as a hard support area.
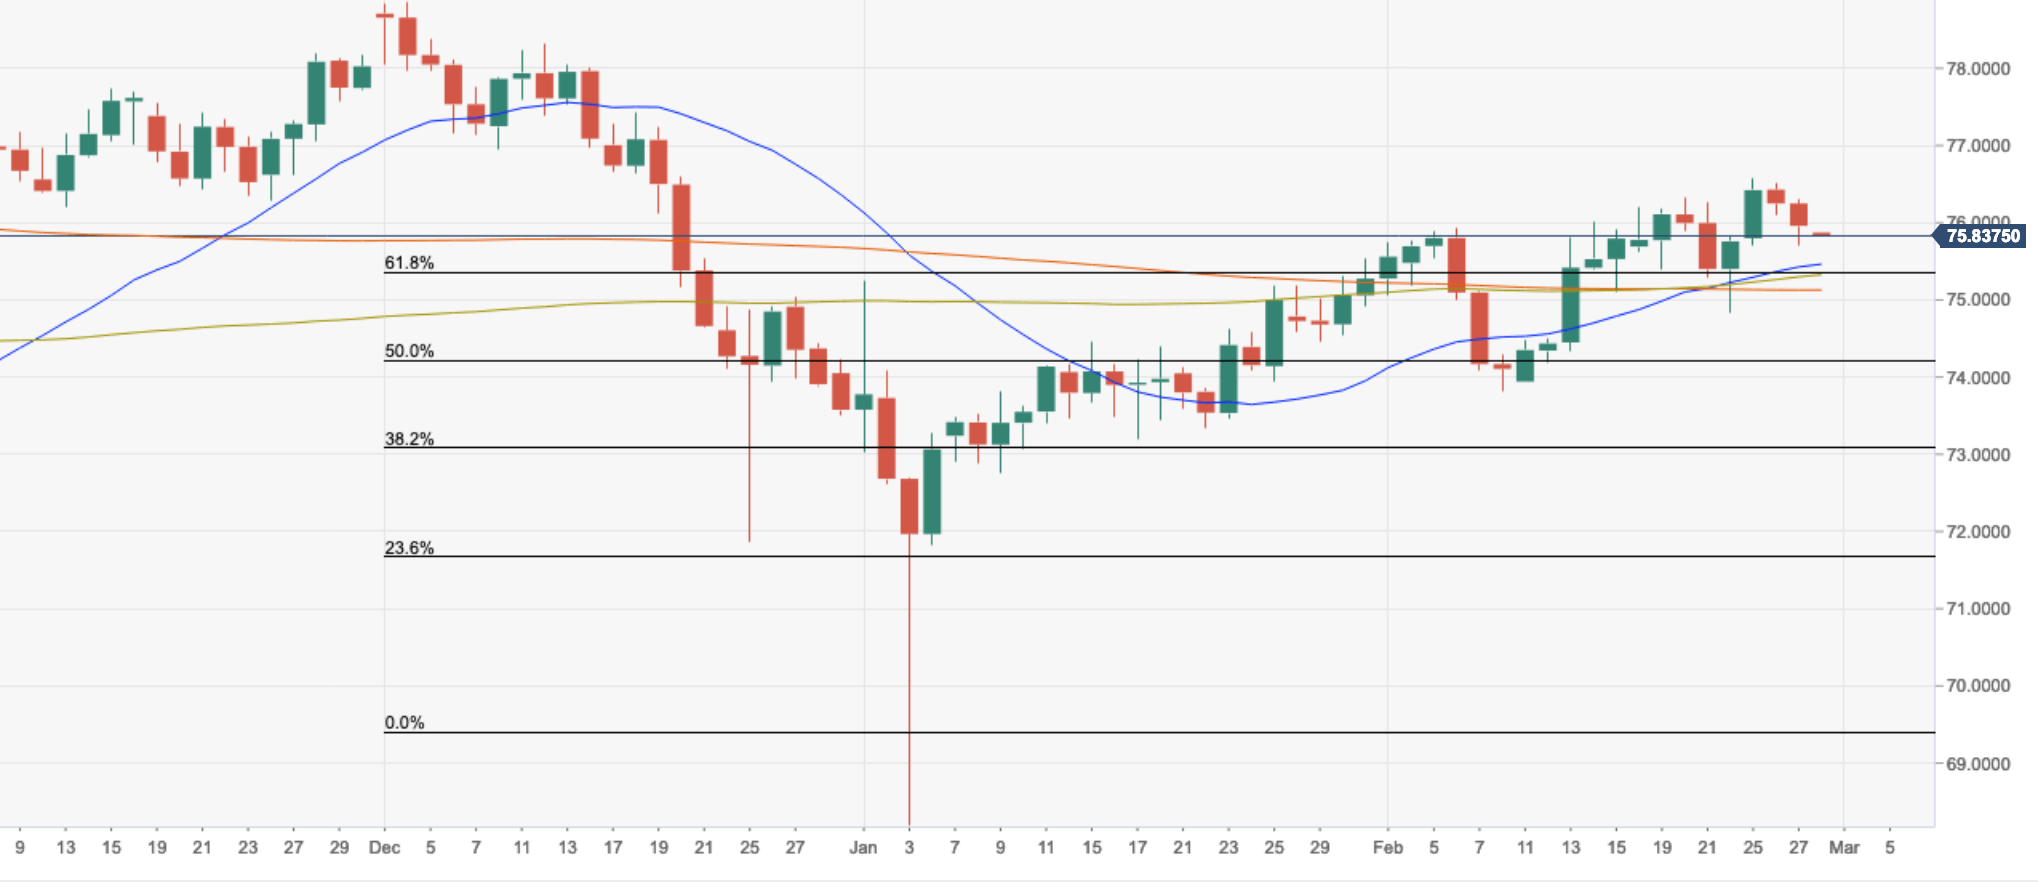
NZD/JPY daily chart
