- NZD/USD is trading 0.69% lower on Tuesday despite the USD being down against some of the other majors.
- There is a large trendline the price has just rejected and the market could be heading toward lower levels.
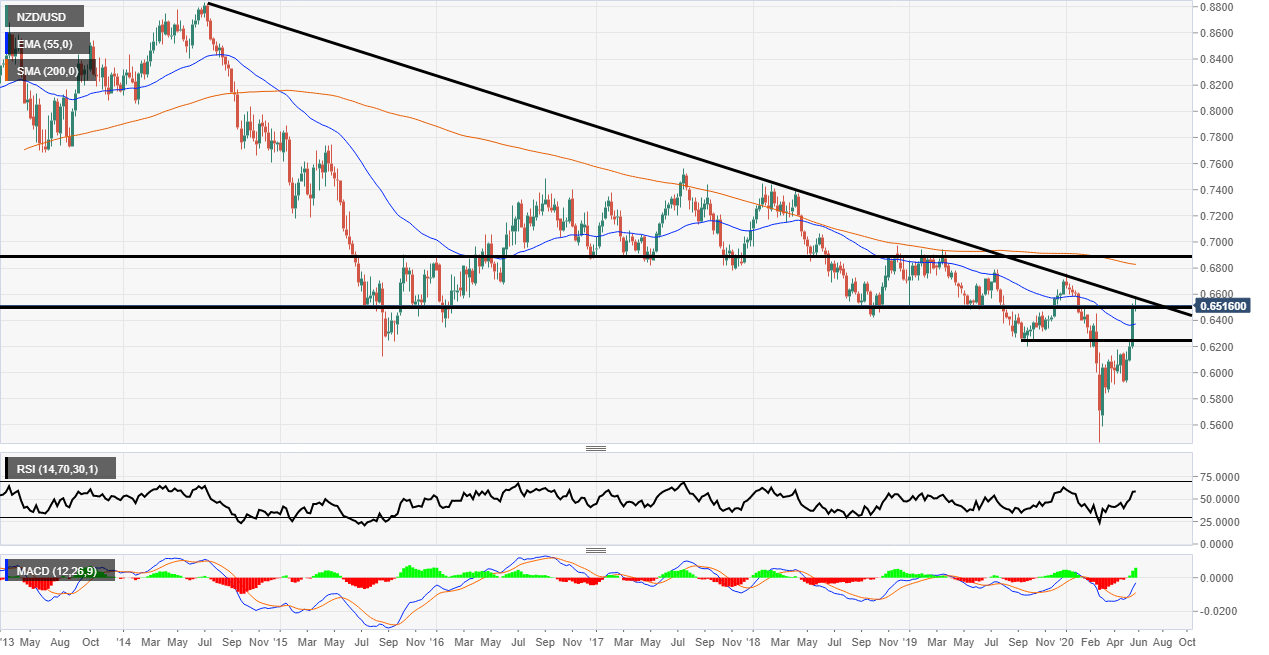
NZD/USD weekly chart
The NZD/USD pair has had a remarkable rise from the ashes in recent weeks and it seems the bears have carefully crept back into the market today. The main point of resistance came from this trendline dating back to July 2014. The next peak then turned up in 2018 between February and April where the price bounced off the resistance two more times, solidifying its utility.
Now it seems the market is backtesting the zone once again. On this timeframe, the trend is still very much down but if you look at the 4-hour and possibly the daily there could be some conflict. For this to change the wave high of 0.6756 would need to be broken to make a new wave high.
In terms of the indicators, the price is now above the 55 Exponential Moving Average but below the 200 Simple Moving Average. The Relative Strength Index is above 50 and not looking tippy yet while the MACD histogram is green but the signal lines are still lagging.
Much will depend on this week’s Fed meeting and rate decision but it seems there are signs of exhaustion in this NZD rally.
Additional levels
