- NZD/USD seesaws around four-month high, recently stepped back from 0.6581.
- Successful trading above 100-week SMA keeps the bulls directed to the key trend line.
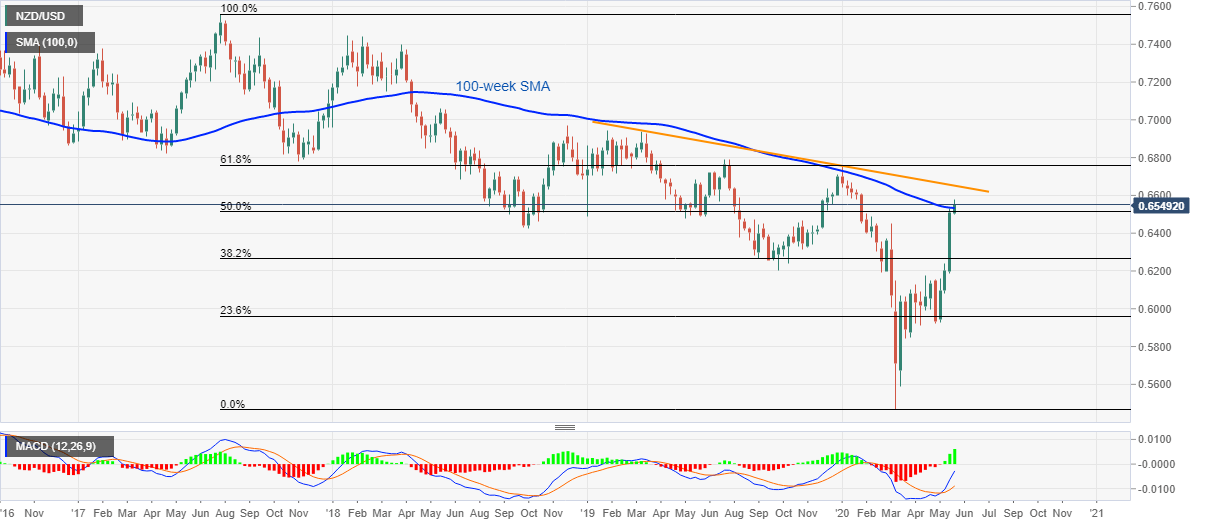
- Sellers may await a downside break of 50% Fibonacci retracement for validation.
NZD/USD steps back from late-January top to 0.6550, down 0.14% on a day, during Tuesday’s Asian session.
Even so, the kiwi pair stays above 100-week SMA as well as 50% Fibonacci retracement of its fall from July 2017 to March 2020.
As a result, bulls remain optimistic to confront a falling trend line from late-March tops, around 0.6655/60, during the further upside.
However, any more rise past-0.6660 will find it difficult unless breaking 61.8% Fibonacci retracement level of 0.6760.
Meanwhile, pair’s declines below 100-week SMA level of 0.6530 needs validation from 50% Fibonacci retracement, at 0.6510, to revisit March month high surrounding 0.6450.
NZD/USD weekly chart
Trend: Bullish
