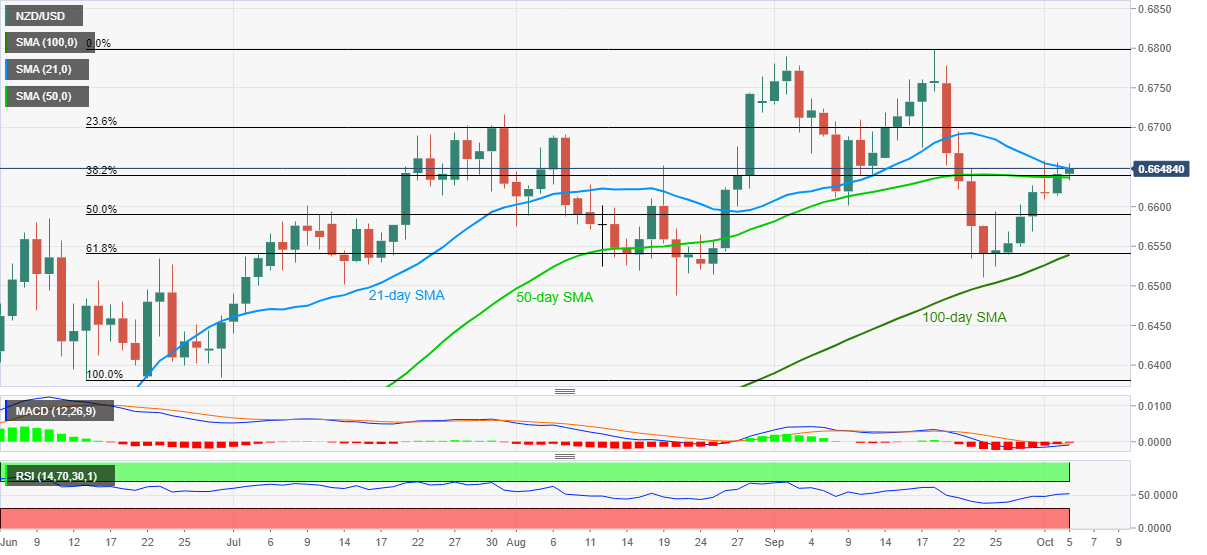
- NZD/USD trades beyond 50-day SMA for the first time in two weeks.
- MACD trims bearish bias but 21-day SMA holds the key to further upside.
- 100-day SMA, 61.8% Fibonacci retracement acts as strong support.
NZD/USD seesaws near the intraday high of 0.6655, currently around 0.6650, during the early Monday. The kiwi pair rises for the second consecutive day while keeping its upside break of 50-day SMA. However, 21-day SMA restricts the quote’s immediate upside.
Considering the normal RSI conditions and a receding bearish bias of the MACD, the bulls are likely to cross the 21-day SMA hurdle, at 0.6650 now, this time.
As a result, NZD/USD buyers can aim for July high near 0.6715 during the further upside whereas 0.67580/85 and the September month’s high close to 0.6800 may flash on their radars afterward.
On the downside, 38.2% Fibonacci retracement of the pair’s mid-June to September 18 upside, coupled with the 50-day SMA, offers immediate support around 0.6635.
While a downside break of 0.6635 will quickly drag NZD/USD towards a 50% Fibonacci retracement level of 0.6590, any further weakness will be tamed by a confluence of 100-day SMA and 61.8% Fibonacci retracement near 0.6540.
NZD/USD daily chart
Trend: Further recovery expected

