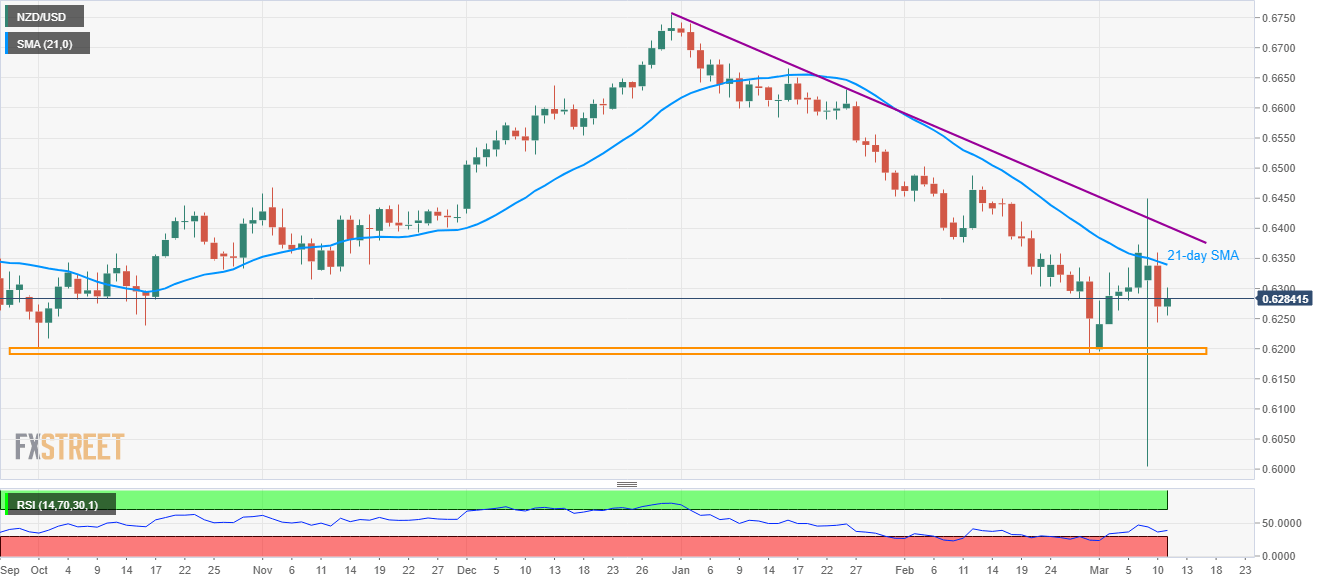
- NZD/USD consolidates the previous day’s losses, maintains the U-turn from 21-day SMA.
- A horizontal area comprising November and February lows acts as the key support.
Following its another decline from 21-day SMA, NZD/USD retraces 0.15% to 0.6283 during early Wednesday.
In addition to the 21-day SMA level of 0.6340, a downward sloping trend line since December 31, 2019, currently around 0.6400, also acts as the key resistance.
If at all buyers manage to extend the recovery gains beyond 0.6400 on a daily closing basis, they confirm the broad descending triangle’s break, which in turn can propel the run-up towards the early-January lows surrounding 0.6600.
Meanwhile, 0.6240 can act as immediate support ahead of the 0.6200/6190 horizontal region.
Should there be a further downside past-0.6190, the quote can revisit the Monday’s flash crash low near 0.6000.
NZD/USD daily chart
Trend: Bearish

