- NZD/USD bounces off a multi-week-old support line but stays below 61.8% Fibonacci retracement.
- A descending trend line from late-January adds to the resistance.
- November 2019 low can return to the chart during further declines.
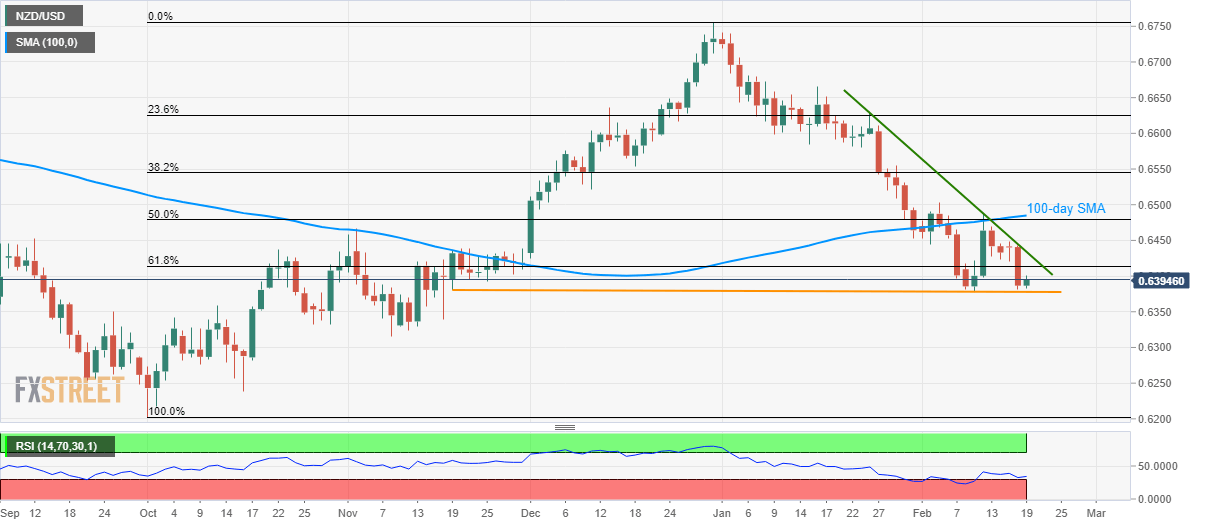
NZD/USD consolidates losses to 0.6395, up 0.15%, during early Wednesday. The pair recently took a U-turn from a horizontal line stretched from November 19. Though, the quote still remains below 61.8% Fibonacci retracement of its October-December 2019 upside.
In addition to the immediate key Fibonacci resistance near 0.6415, a downward sloping trend line since January 24, 2020, around 0.6435, also questions the pair’s latest recovery.
Furthermore, a confluence of 50% Fibonacci retracement and 100-day SMA, close to 0.8480/85, becomes the tough nut to crack for buyers.
Alternatively, the pair’s daily closing below 0.6377 will open the door for the extended declines to November 2019 low surrounding 0.6315.
Also up on the sellers’ radar post-0.6315 will be October 16, 2019 bottom and October 2019’s monthly low, respectively around 0.6240 and 0.6200.
NZD/USD daily chart
Trend: Pullback expected
