- NZD/USD refreshes the eight-week low, rests near 50% Fibonacci retracement.
- 100-day SMA, November month high will challenge sellers.
- 200-day SMA guards the immediate upside.
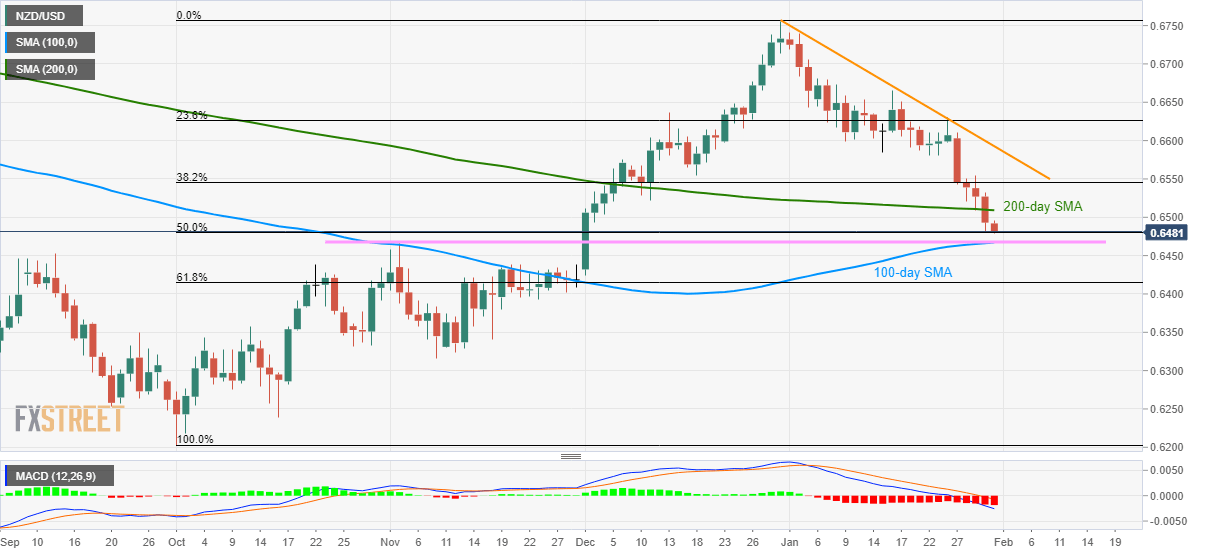
NZD/USD declines to the fresh eight-week low of 0.6479, -0.20%, by the press time of early Friday. The pair dropped below 200-day SMA the previous day but is yet to provide a daily closing below 50% Fibonacci retracement level of October-December 2019 upside.
Following the 0.6480 support, sellers will look for a clear break below 100-day SMA and November high, at 0.6467 now, to aim for November 20 high near 0.6440.
In a case where prices keep being weak past-0.6440, 61.8% Fibonacci retracement near 0.6415 and November 08 low around 0.6315 will gain market attention.
Meanwhile, an upside daily close beyond a 200-day SMA level of 0.6510 can push the pair to 38.2% Fibonacci retracement level of 0.6545 and then to January 22 low near 0.6580.
However, a downward sloping trend line from December 31, 2019, at 0.6595, could challenge the pair’s recovery moves beyond 0.6580.
NZD/USD daily chart
Trend: Bearish
