- NZD/USD seesaws around the intraday low of 0.6681.
- Bullish MACD questions the pair’s downside below near-term key SMA.
- 0.6715-20 adds to the upside filters, 21-day SMA on sellers’ radar.
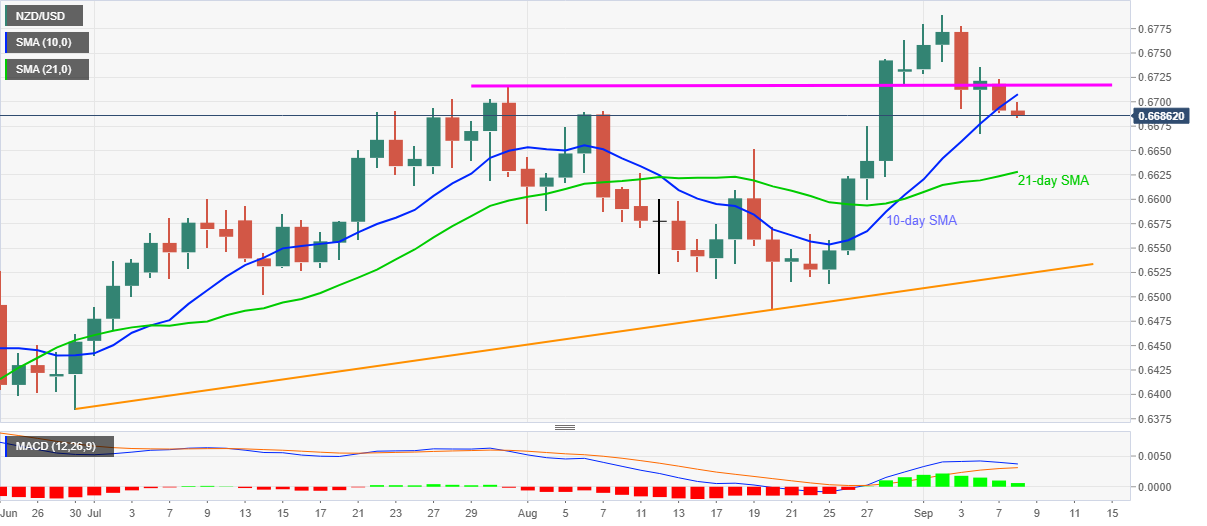
NZD/USD drops to 0.6687, down 0.05% on a day, during the pre-European session trading on Tuesday. The quote slipped below 10-day SMA by the end of Monday and carries the weakness forward. Though, bullish MACD signals and the early-August tops probe the bears.
Hence, sellers await a clear break of 0.6690 before targeting the August 19 top of 0.6652 and 21-day SMA near 0.6630.
While 0.6600 can challenge the pair’s further downside past-0.6630, an ascending trend line from June 30, at 0.6522 now, will be the key to watch afterward.
Alternatively, an upside clearance of 10-day SMA, at 0.6707 now, won’t be enough to recall the bulls as July month’s high joins August 31 low near 0.6720/15 to challenge the pullback.
If at all the buyers manage to cross 0.6720 resistance, the pair’s run-up to refresh the monthly high, currently at 0.6790, can’t be ruled out.
NZD/USD daily chart
Trend: Pullback expected
