- NZD/USD has carved out a double top pattern on the daily chart.
- A close below the neckline support of 0.6601 would confirm a breakdown.
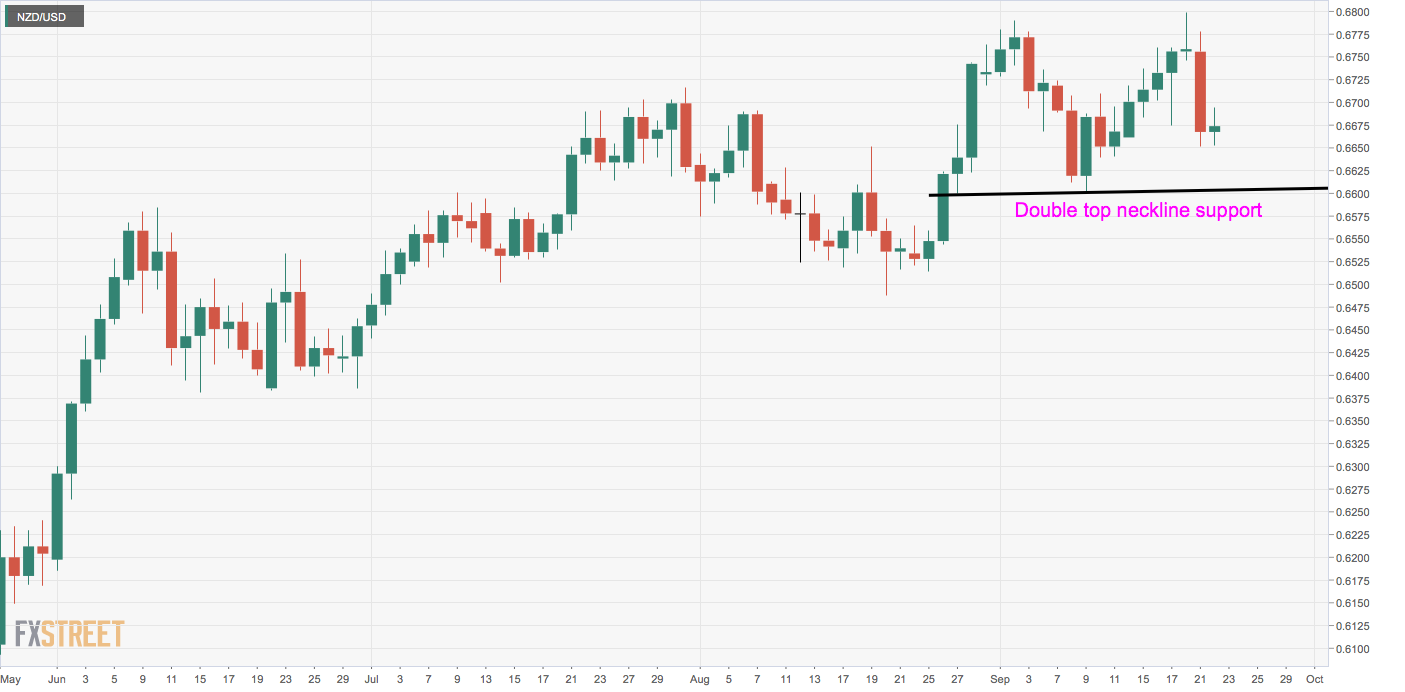
NZD/USD’s daily chart shows a double top pattern – the buyers failed to chew through offers around 0.68 on Friday and on Sept. 2.
The Sept. 9 low of 0.6601 is the neckline support of the double top pattern. A close below that level would create room for a sell-off to 0.64 (target as per the measured move method).
A drop to 0.6601 looks likely, as the daily chart is showing a bearish reversal candlestick pattern. The pair fell by 1.23% on Monday, validating or confirming the bullish-to-bearish trend change signaled by Friday’s inverted hammer.
At press time, the pair is trading at 0.6674, having hit a low of 0.6653 early today. A close above 0.68 is needed to invalidate the bearish candlestick pattern.
Daily chart
Trend: Bearish
Technical levels
