- NZD/USD remains pressured below the weekly resistance line, 200-HMA.
- China data flashed mixed signals with headline GDP down 6.8% on YoY.
- The immediate rising support line holds the key to weekly low.
NZD/USD slips from 0.6017 to 0.6006, current up 0.7% on a day to 0.6010, after China released its much-awaited statistics during early Friday.
Read: China’s GDP contracts 6.8% YoY in Q1 vs. -6.5% expected, AUD/USD little changed
Given the Kiwi pair’s sustained trading below key HMA and a short-term important resistance line, the sellers are likely to remain at the helm.
Though, an immediate support line around 0.5990 can question the bear’s target of the previous day’s low near 0.5920.
If NZD/USD prices remain weak below 0.5920, the monthly bottom surrounding 0.5845/40 will be in focus.
Meanwhile, a 200-HMA level of 0.6030 and the descending trend line from April 14, at 0.6037, can challenge the pair’s immediate upside.
Should buyers manage to cross the near-term resistance trend line, 0.6110 and the weekly top close to 0.6130 may become their favorites.
NZD/USD hourly chart
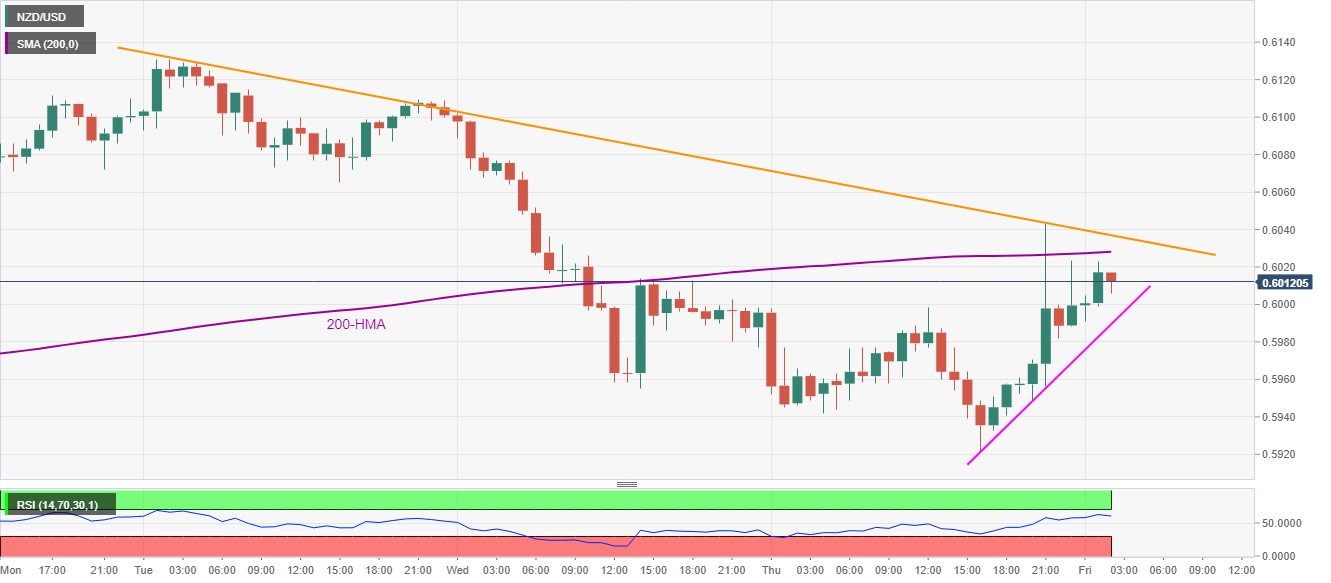
Trend: Bearish
