- NZD/USD trims early Asian session losses but stays below the key Fibonacci retracement level.
- Bearish MACD, failures to cross 21-day SMA, previous support line favor sellers.
- 100-day SMA, two-month-old horizontal region lure kiwi bears, 0.7310 adds to the upside filters.
NZD/USD consolidates recent losses while keeping the bounce-off intraday low of 0.7138 to 0.7154, down 0.15% on a day, during early Monday. Even so, the kiwi pair stays below 61.8% Fibonacci retracement level of December 2020 to February 2021 upside.
Additionally, the pair’s sustained pullback from 21-day SMA and a support-turned-resistance line from January also portray the NZD/USD weakness amid bearish MACD.
As a result, short-term sellers keep a 100-day SMA level of 0.7120 on their radars unless the quote stays below the stated key Fibonacci retracement hurdle surrounding 0.7180.
However, any further downside past-0.7120 will have a bumpy road as the 0.7100 round-figure and a horizontal area comprising lows marked since late-January, around 0.7100-0.7090, will be tough supports to break for NZD/USD sellers.
On the contrary, an upside break of 0.7180 needs to cross a convergence of 21-day SMA and 50% Fibonacci retracement near 0.7235 before eyeing further gains towards the previous resistance line, at 0.7275 now.
NZD/USD daily chart
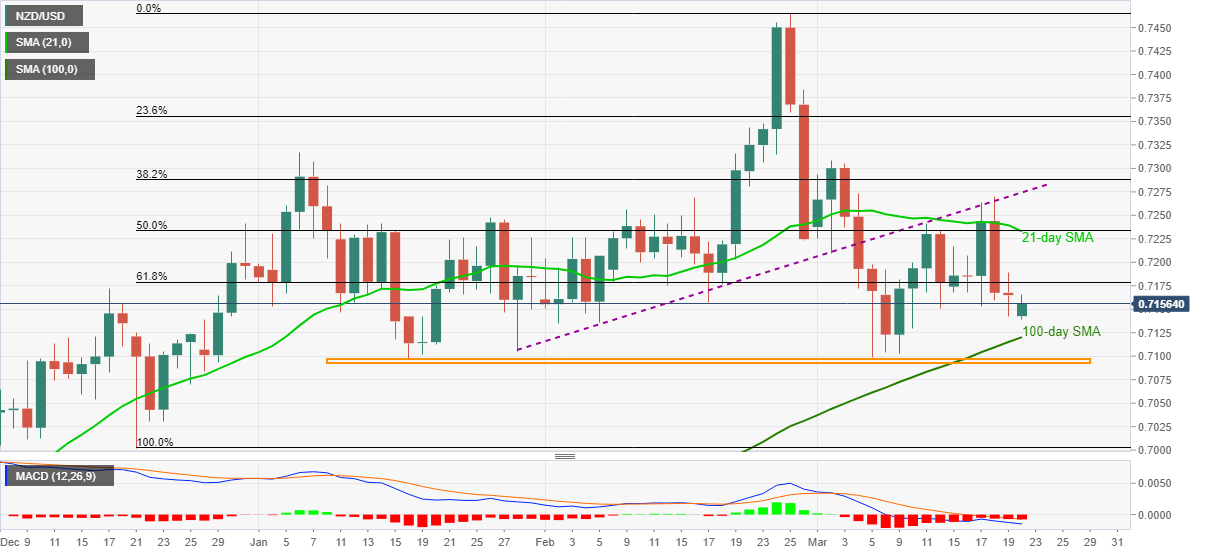
Trend: Bearish
