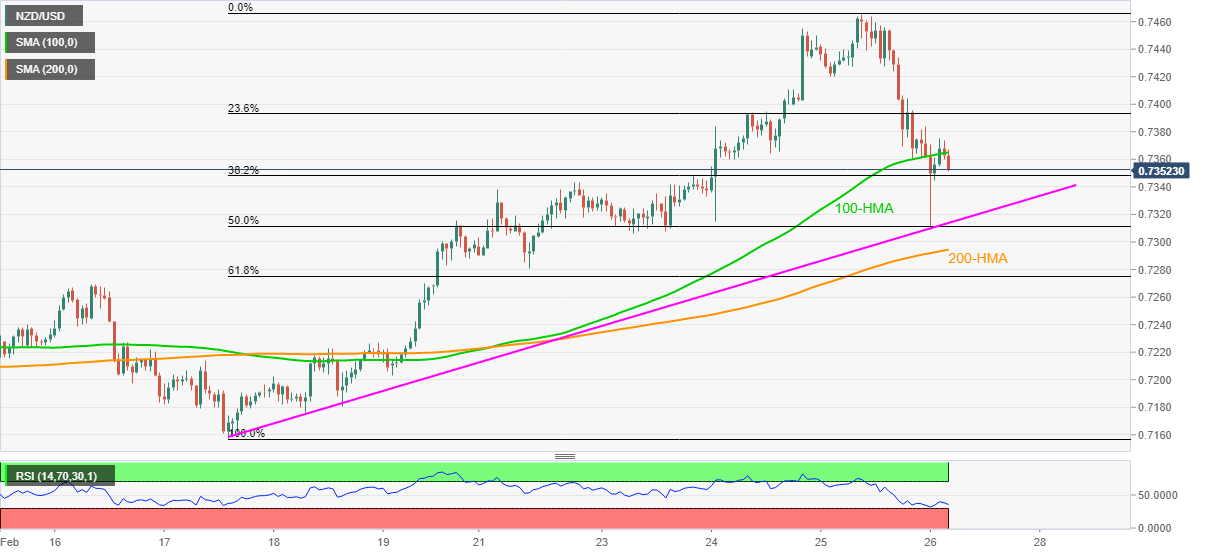
- NZD/USD remains on the back-foot, fails to break above 100-HMA.
- 200-HMA follows a confluence of key support line, 50% Fibonacci retracement to test bears.
- Bulls need confirmation from 0.7420 to retake controls.
NZD/USD drops to 0.7354 in a fresh pullback from the latest swing top of 0.7375, down 0.18% intraday, during early Friday.
The kiwi pair staged a corrective pullback from a one-week-old support line, coupled with a 50% Fibonacci retracement level of February 17-25 upside, amid oversold RSI. However, failures to sustain a break of 100-HMA seem to trigger the recent weakness.
NZD/USD sellers currently target the 0.7310 support convergence having the stated trend line and Fibonacci retracement level. Though, any further weakness will be tamed by a 200-HMA level of 0.7295.
On the contrary, fresh recovery moves not only need to cross the 100-HMA level of 0.7365 but also the early Thursday lows near 0.7420 to recall the NZD/USD buyers.
Following that, the latest high, also the highest since August 2017, will challenge the Kiwi bulls around 0.7465.
NZD/USD hourly chart
Trend: Further weakness expected

