- NZD/USD remains on the back foot after breaking the monthly support line, now resistance.
- 50-day SMA adds to the upside barrier, 21-day SMA limits immediate downside.
NZD/USD justifies the break of four-week-old ascending trend line while declining to 0.5955, down 0.71% on a day, during the early Thursday.
While a sustained downside below the near-term key support line, now resistance, favors the pair’s further declines, 21-day SMA, near 0.5940/35, limits the immediate downside.
As a result, sellers may await a daily closing under 0.5935 for fresh entry while targeting the monthly bottom close to 0.5845.
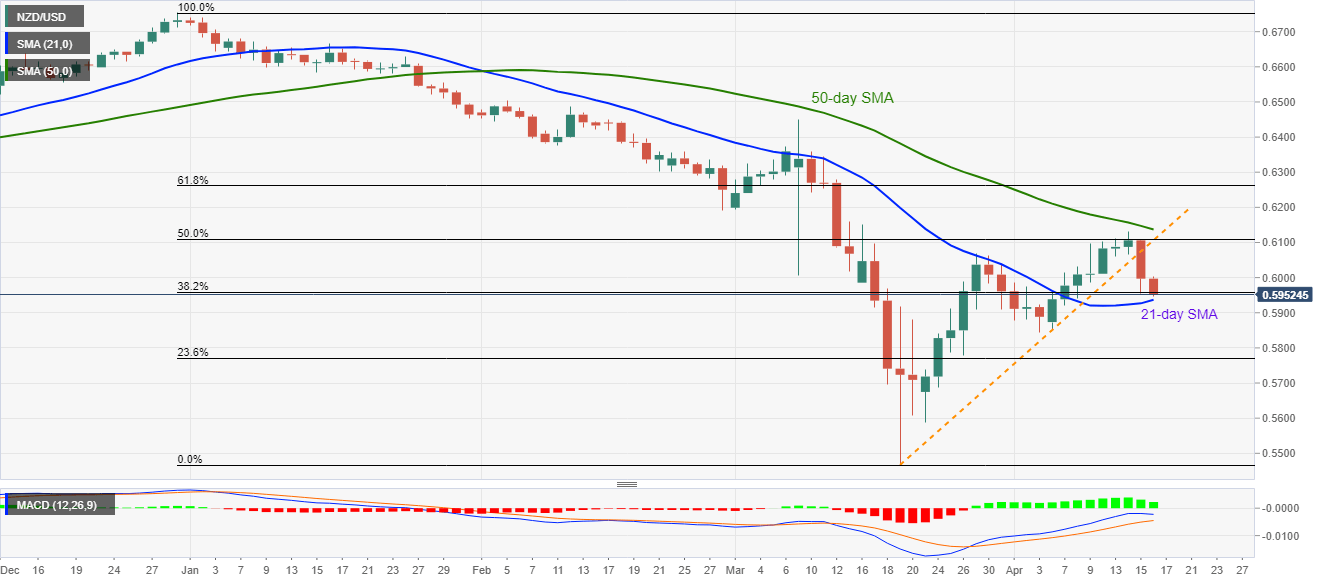
Alternatively, 0.6105/10 resistance confluence, including 50% Fibonacci retracement of January-March downside as well as the support-turned-resistance line, could keep buyers away.
Also adding barriers to the pair’s upside attempts is the 50-day SMA level, currently near 0.6140.
NZD/USD daily chart
Trend: Bearish
