- NZD/USD stays on the bids for the third consecutive day.
- A sustained break of 50-day EMA, 61.8% Fibonacci retracement keeps buyers hopeful.
- 100-day EMA adds to the upside barriers.
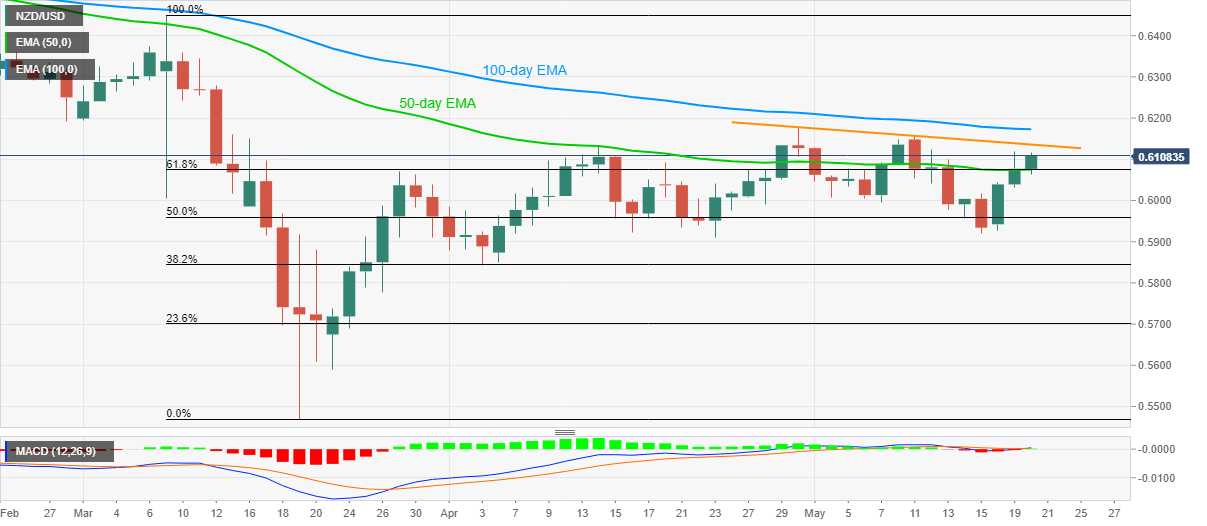
NZD/USD takes the bids near 0.6105/10, up 0.50% on a day, amid the pre-European session on Wednesday. In doing so, the kiwi pair maintains its break of a joint comprising 50-day EMA and 61.8% Fibonacci retracement of March month fall.
As a result, buyers seem to target a falling trend line from April 30, at 0.6135 now, ahead of confronting the 100-day EMA figures around 0.6175.
If at all the NZD/USD prices remain positive beyond 0.6175, February month low near 0.6195 can offer an intermediate halt during the rise to March top surrounding 0.6450.
On the contrary, the pair’s daily closing below 0.6075 support confluence can recall 0.600 round-figures on the charts.
However, 50% of Fibonacci retracement and the monthly bottom could check further downside around 0.5960 and 0.5920 respectively.
NZD/USD daily chart
Trend: Further recovery expected
