- NZD/USD is showing opportunities for both the bulls and bears either side of daily support.
- Opposing 0.7130 vs 0.6908 initial targets are derived from a top-down analysis.
NZD/USD has rallied strongly from support and bears will be looking for a correction.
For the time being, however, the price remains above daily support structure so it can continue higher towards a monthly point of control.
The following is a top-down analysis to illustrate where the next opportunities might arise.
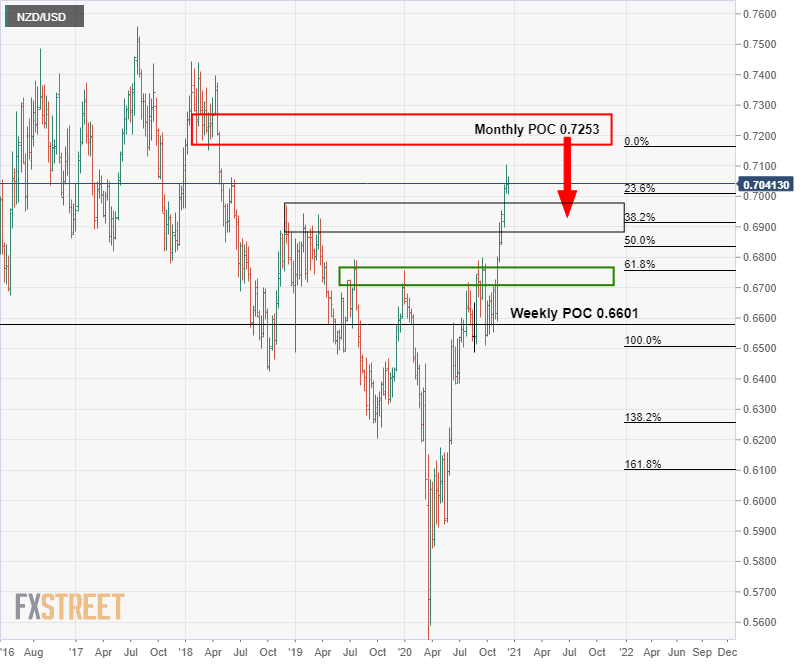
Monthly chart
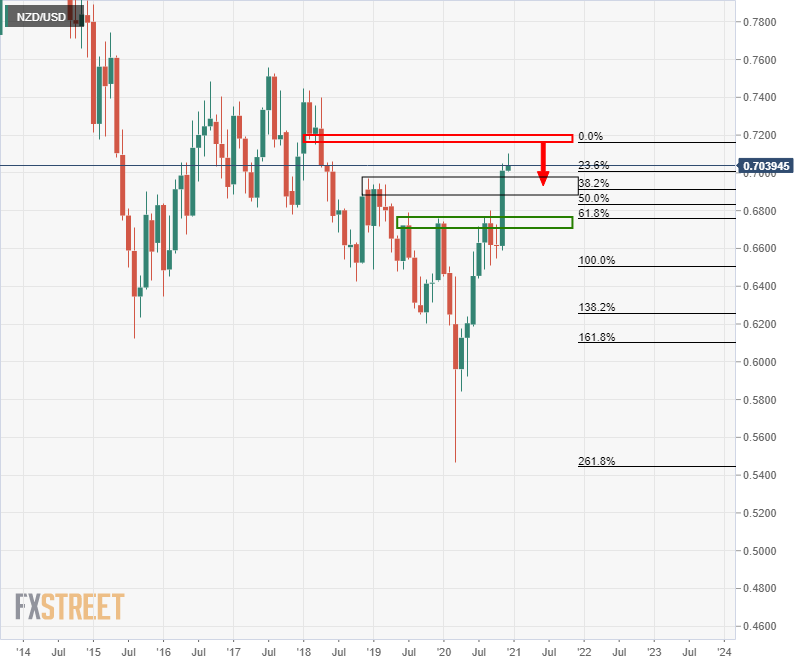
Weekly chart
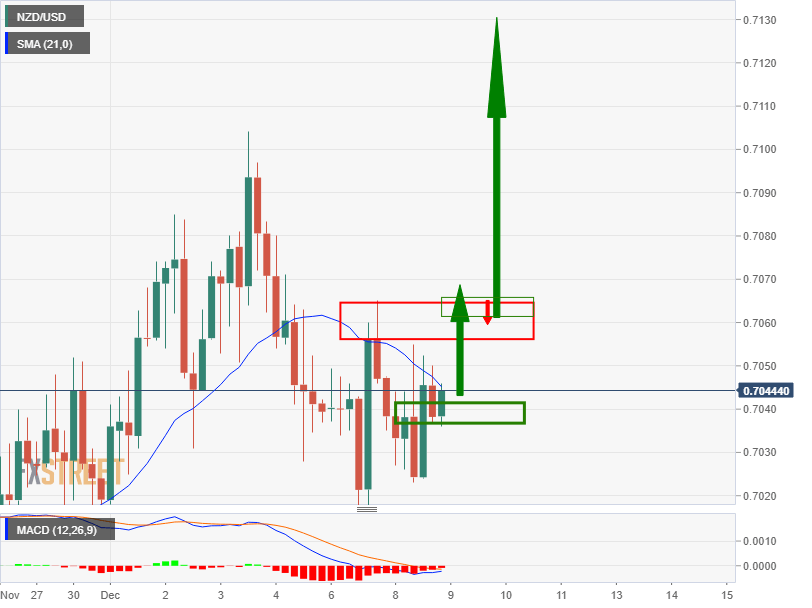
Daily chart
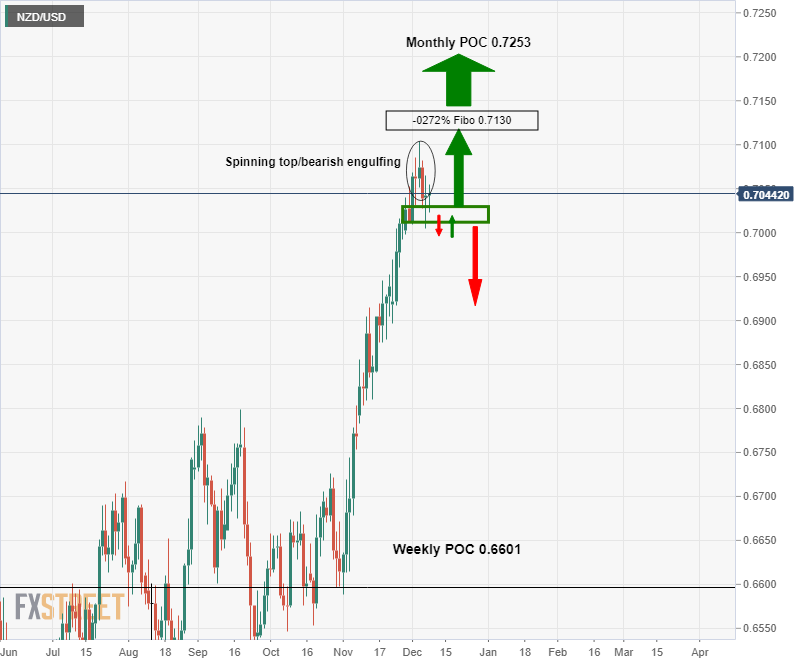
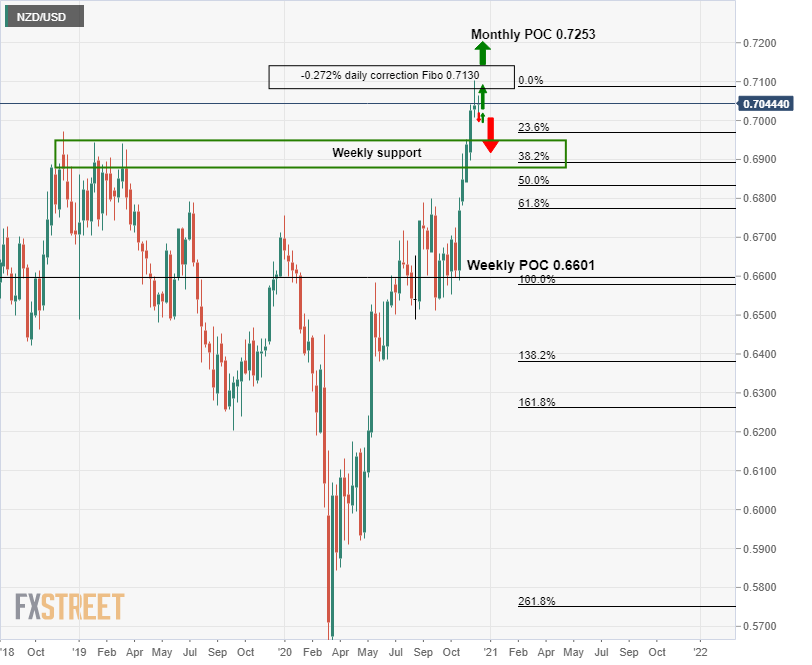
0.7130 is the first upside target as a -0.272% Fibonacci retracement of the correction’s range. 0.7230 is the monthly point of control (POC) target.
However, if there is a break below the daily structure, then the bias will be to the downside.
For a target, the weekly Fibs can be drawn up against prior resistances as follows:
Downside target, weekly 38.2% Fibo
0.6908 marks the weekly 38.2% Fibonacci retracement level.
Bears can target this if the daily top candlestick formation proves too much for the bulls and we see closes and subsequent bearish structure formed below daily support.
Bullish scenario
The price is in a bearish environment on the 4-hour chart still, so there are no current opportunities on the upside.
However, if the price moves beyond the 7th Dec highs, on a restest of newly formed structure acting as support, bulls could target the daily corrections -0.272% Fibonacci level of 0.7130.