- NZD/USD accelerates the north-run after upbeat China trade data.
- 50-day SMA holds the gate for 61.8% Fibonacci retracement, bullish MACD favors buyers.
- The late-March top, short-term support line, limit immediate declines.
NZD/USD takes the bids to 0.6120 after benefiting from China’s upbeat trade numbers amid the early Tuesday’s trading session.
Read: China’s Trade Balance (CNY): Returns to surplus in March, imports pop while exports drop
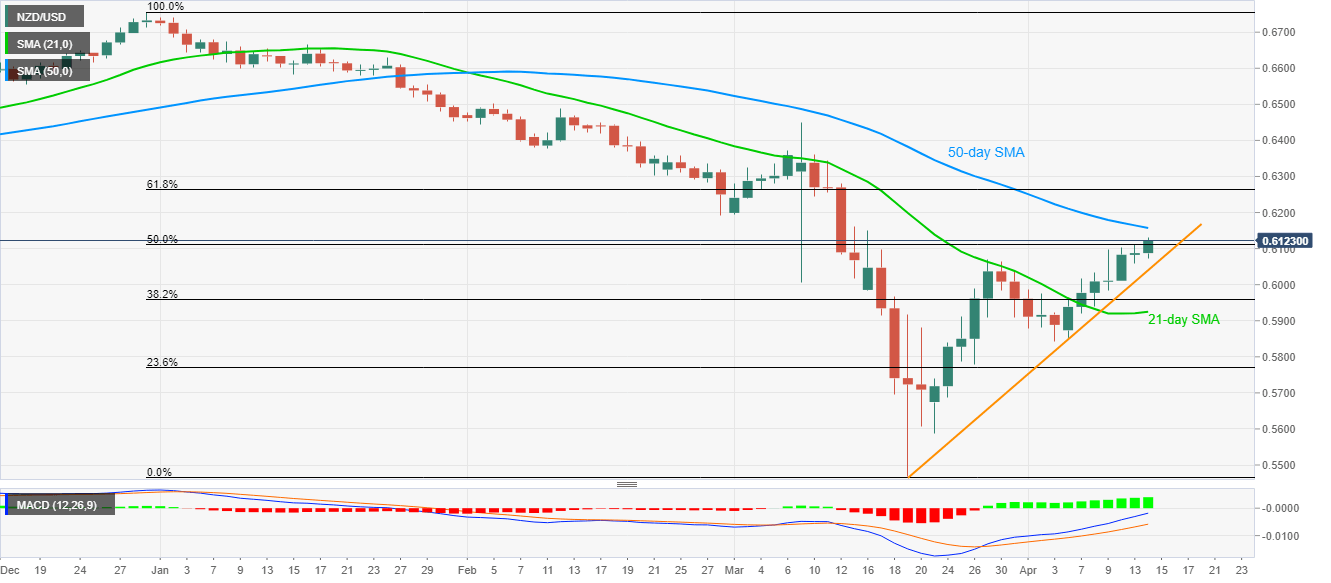
The pair currently aims to confront a 50-day SMA level of 0.6158 whereas 61.8% Fibonacci retracement of its declines between December 31, 2019, and March 19, 2020, near 0.6260/65, could check the bulls afterward.
It should also be noted that February month low near 0.6190 can offer an intermediate halt during the pair’s rise beyond 50-day SMA and also towards 61.8% Fibonacci retracement.
Alternatively, March 27 high near 0.6070, followed by an 18-day-old rising support line near 0.6040, could restrict the pair’s short-term downside ahead of 0.6000 psychological magnet.
NZD/USD daily chart
Trend: Bullish
