- NZD/USD eases from one-week high to attack the intraday low.
- 50-day SMA, area comprising multiple levels since late-June on the sellers’ radar.
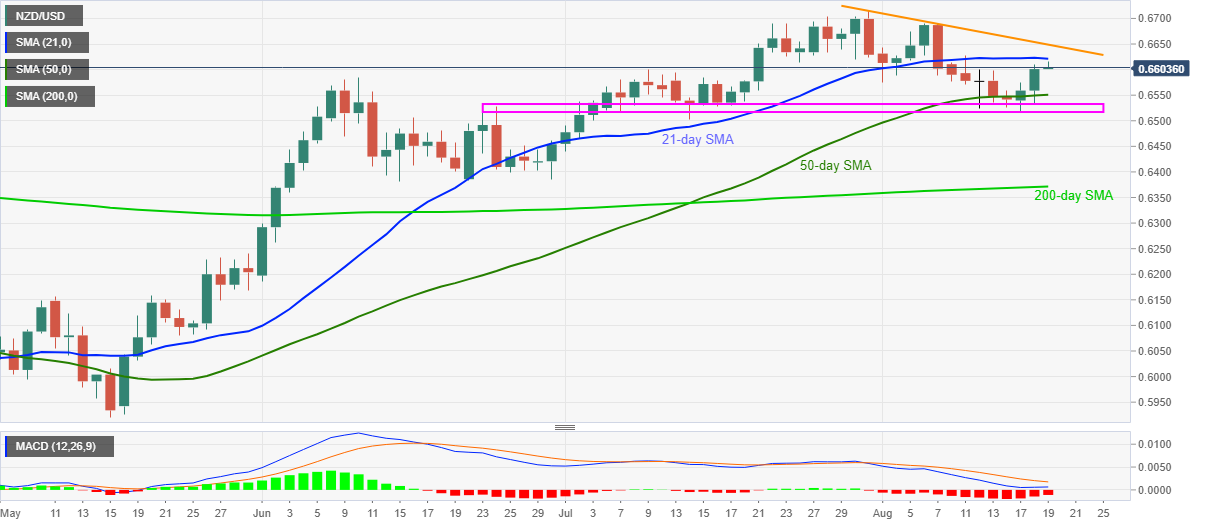
- The monthly resistance line adds to the upside barriers.
Following its failures to rise past-0.6616, NZD/USD seesaws around 0.6600 during the early Wednesday. The kiwi pair earlier surged to the highest since August 11 but failed to cross 21-day SMA for the second time in the current month.
The pullback moves tack bearish MACD signals to suggest further weakness towards a 50-day SMA level of 0.6550. However, a horizontal area comprising June 23 high and multiple lows marked afterward, around 0.6535/20, could challenge the bears then after.
If at all the sellers manage to conquer 0.6520 level, the 0.6500 threshold may offer an intermediate halt during the quote’s anticipated slump to a 200-day SMA level of 0.6371.
Alternatively, a clear break above 0.6621 level comprising 21-day SMA will have to cross a downward sloping trend line from July 31 to convince buyers to attack the monthly top near 0.6690.
Furthermore, the July month top around 0.6715 and the yearly top close to 0.6740 hold the key to pair’s run-up towards December 2019 peak surrounding 0.6755.
NZD/USD daily chart
Trend: Pullback expected
