- NZD/USD rises to fresh high since April 25, 2018.
- Sustained trading beyond the key SMA and trend line resistances join bullish MACD to favor buyers.
- 0.7000 threshold offers immediate support, bears will remain cautious unless breaking 200-week SMA.
NZD/USD rose to the highest in 31 months while recently flashing 0.7114 as the intraday top. The quote currently trades near 0.7105, up 0.15% on a day, during early Friday.
Although NZD/USD advances for the sixth consecutive week, its ability to stay positive beyond the key SMAs and resistance lines, coupled with bullish MACD, indicates further north-run towards March 2018 low near 0.7150.
In a case where the kiwi bulls dominate past-0.7151, February 2017 peak surrounding 0.7375 may gain major attention.
Meanwhile, the 0.7000 round-figure restricts the quote’s pullback moves ahead of an upward sloping trend line from March 2020, at 0.6980 now.
Even if the NZD/USD sellers sneak in below 0.6980, a descending support line from July 2017 and 200-week SMA, respectively around 0.6820 and 0.6765, will be the tough nuts to crack for them.
NZD/USD weekly chart
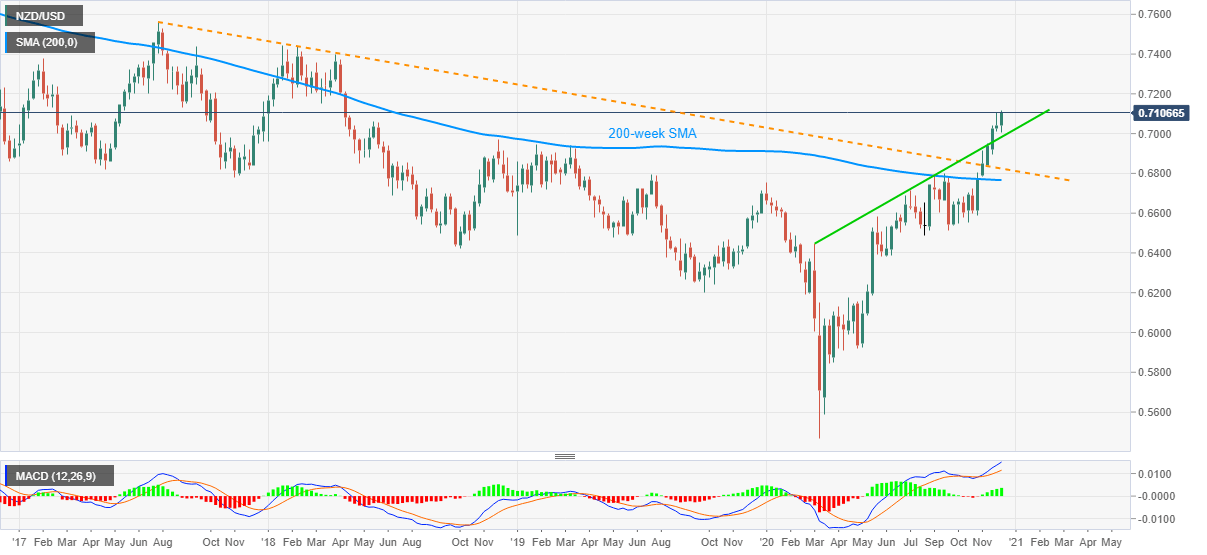
Trend: Bullish
