- NZD/USD extends run-up beyond 61.8% Fibonacci retracement, 50-day EMA.
- 100-day EMA adds to the upside barrier.
- A confluence of monthly support line, 50% Fibonacci retracement acts as the tough support.
NZD/USD heads further towards the monthly top while taking the bids near 0.6122, up 0.56% on a day, amid the initial Friday’s trading. Favoring the pair’s run-up is its ability to cross 61.8% Fibonacci retracement of March month declines and 50-day EMA.
As a result, the buyers are looking for April month high near 0.6175 as the immediate resistance while targeting a 100-day EMA level of 0.6195 and 0.6200 during the further upside.
On the flip side, 50-day EMA level of 0.6088 and 61.8% Fibonacci retracement level of 0.6073 will offer immediate support to the pair,
Though, sellers will not get conviction unless finding a daily close below 0.5960/55 support confluence comprising monthly support line and 50% Fibonacci retracement.
NZD/USD daily chart
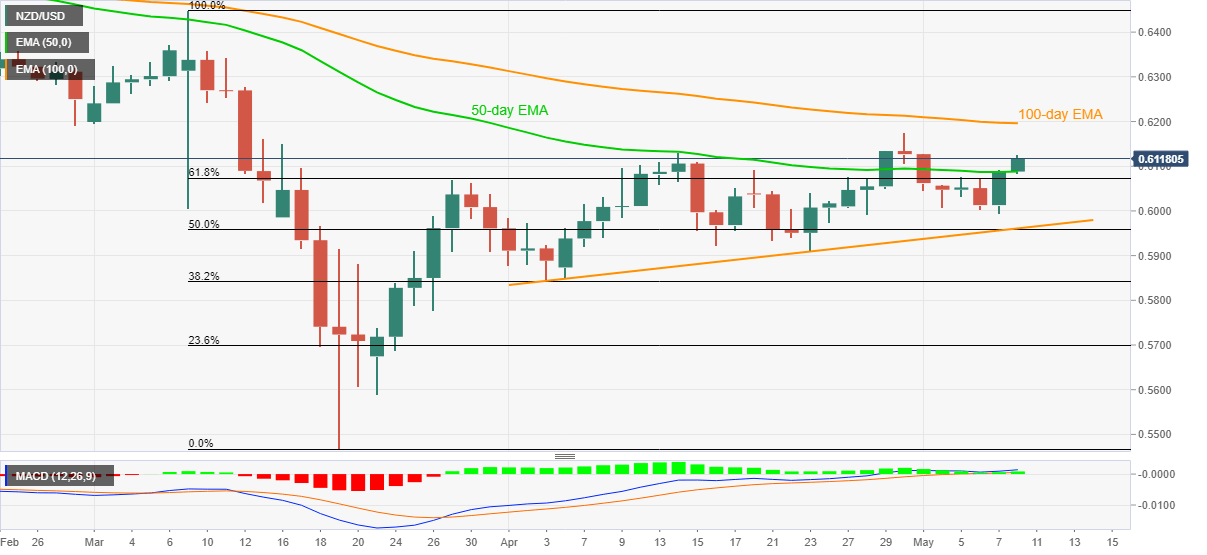
Trend: Bullish
