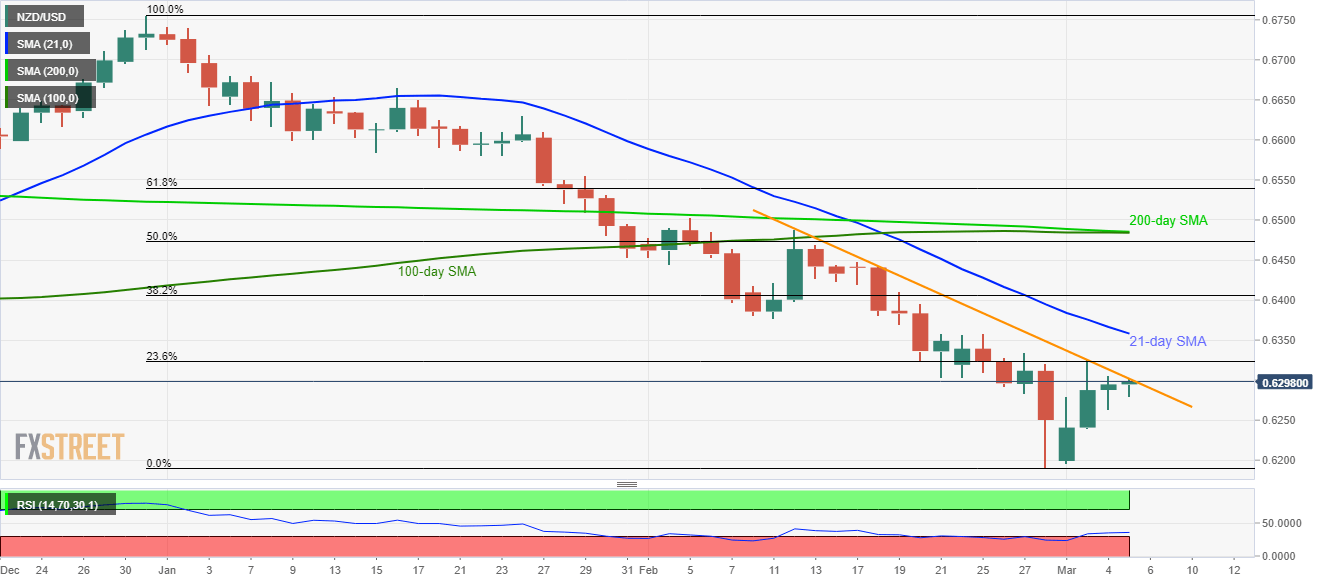
- NZD/USD remains positive, confronts a three-week-old falling trend line.
- 23.6% Fibonacci retracement, 21-day SMA add to the resistance.
- A sustained break of 0.6200 will direct bears to August 2015 low.
While following its four-day recovery moves, NZD/USD questions a short-term descending trend line resistance, currently up 0.06% at 0.6298, amid the early Thursday.
With the gradually rising RSI from oversold conditions, the pullback in prices is likely to remain present. As a result, 23.6% Fibonacci retracement of the pair’s declines from December 31, 2019, to February 28, at 0.6323 will grab buyers’ attention.
Given the quote’s successful trading above 0.6323, 21-day SMA around 0.6360 will be the key to watch.
It should, however, be noted that the bears’ aren’t likely to lose hopes unless the pair registers a clear break of 100/200-day SMA confluence around 0.6485.
On the contrary, 0.6240 and 0.6200 can offer intermediate rest ahead of the latest low near 0.6190 during the pair’s declines.
In a case where the bears keep dominating past-0.6190, the year 2018 bottom close to 0.6145 will lure the sellers.
NZD/USD daily chart
Trend: Further recovery expected
