- NZD/USD’s daily chart shows signs of indecision/uptrend fatigue.
- A close below Wednesday’s low would strengthen the case for a pullback.
NZD/USD traded back and forth on Wednesday, producing a Doji candle on the daily chart.
A Doji, with its long wicks and the negligible body representing a flat close, is considered a sign of indecision in the market place. In NZD/USD’s case, the candle has appeared following a rally from 0.6589 to 0.7084 and indicates buyer exhaustion. The 14-day Relative Strength Index is echoing a similar message.
As such, the pair looks vulnerable to a pullback. The probability of a drawdown would increase if the pair ends Thursday’s under Wednesday’s low of 0.7032.
Alternatively, a close above Thursday’s high of 0.7084 would confirm a bullish Doji continuation pattern – a continuation of the uptrend from 0.6589.
Daily chart
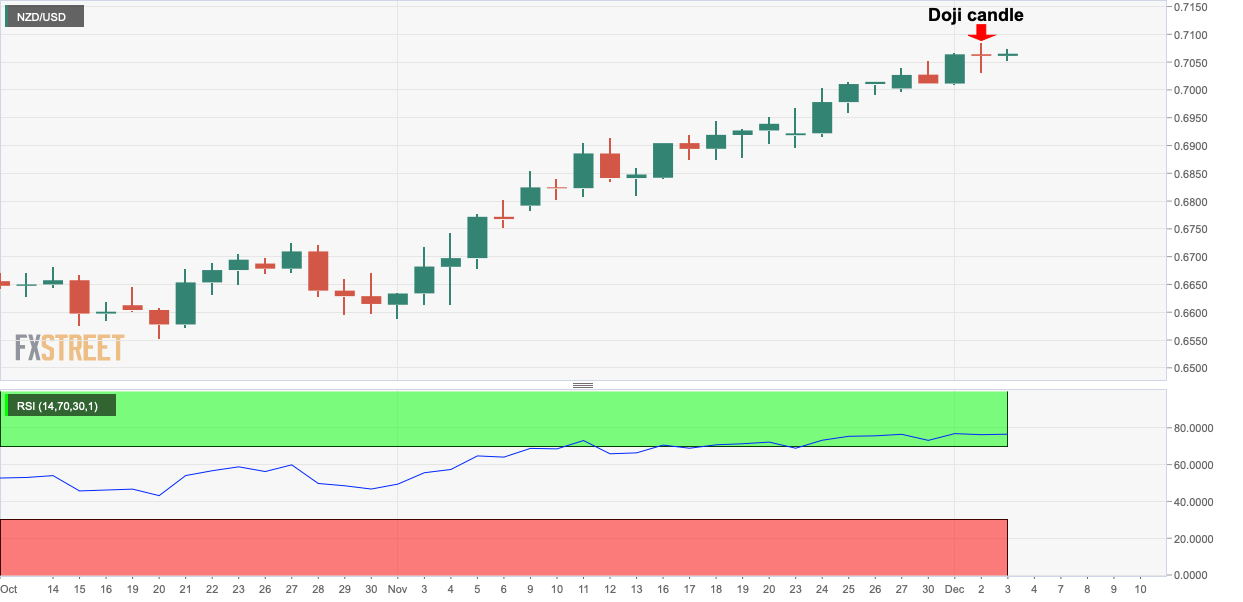
Trend: Bull fatigue
Technical levels
