- NZD/USD extends its uptrend, as all eyes remain on 0.7200.
- Symmetrical triangle breakout on the 1D chart bolsters the run higher.
- Recaptures 50-DMA barrier ahead of the US Retail Sales data.
NZD/USD is building on to the recent rally, looking to test the 0.7200 threshold following a break above the critical 50-daily moving average (DMA) at 0.7158.
The buyers now await the US Retail Sales report for the next push higher.
At the press time, the kiwi trades 0.49% higher at 0.7171, hovering close to fresh three-week highs of 0.7176 reached in the last minutes.
A symmetrical triangle confirmed on the daily chart on Wednesday has offered the much-needed boost to the NZD bulls.
The price has cut through the significant 100 (0.7149) and 50-DMAs, with the bullish RSI, presently at 59.13, suggesting more room to rise for the kiwi.
A test of the 0.7200 round numbers remains on the cards if the March 19 high of 0.7189 is breached convincingly.
NZD/USD: Daily chart
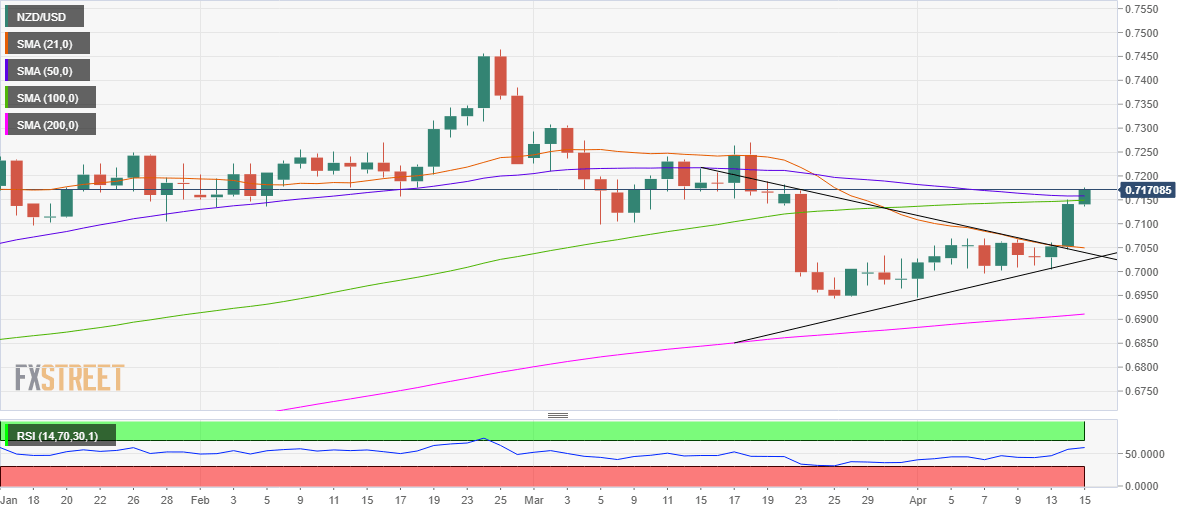
Alternatively, the abovementioned critical resistance now support around 0.7150 could guard the immediate downside.
The next support is seen at 0.7100, below which the 0.7050 confluence zone could be challenged. That zone is the convergence of the 21-DMA and the triangle resistance-now-turned-support.
NZD/USD: Additional levels
