- NZD/USD stays depressed despite upbeat China data, prints mild losses above 0.6750.
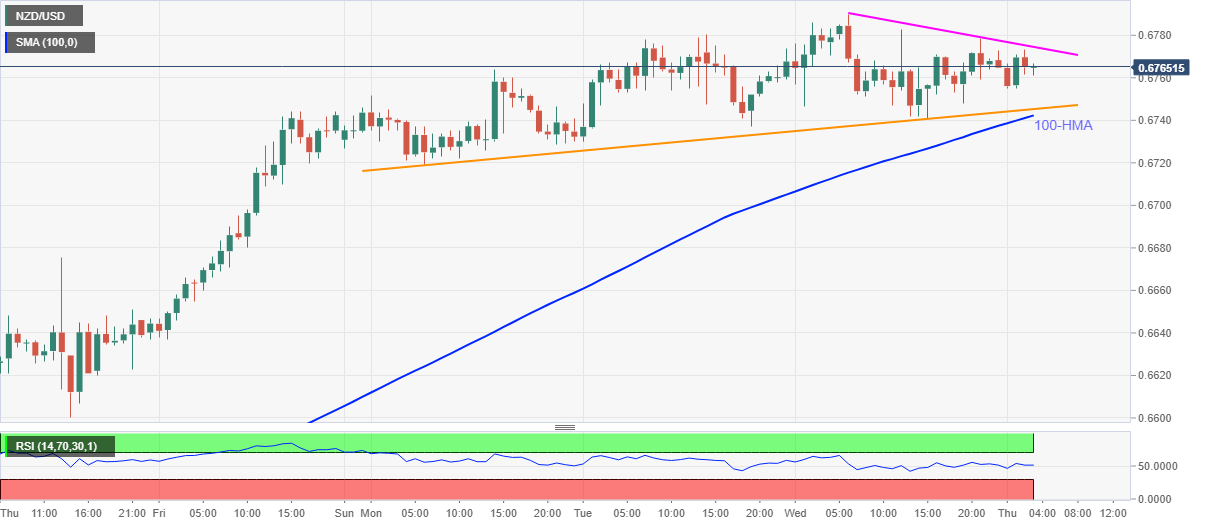
- Normal RSI suggests the pair’s bounce off the short-term key support confluence.
- Monday’s bottom, July high add filters to the downside.
- The 0.6800 round-figures become strong resistance to watch.
NZD/USD fails to deny offers around 0.6765, down 0.13% on a day, amid in the early Wednesday’s trading. In doing so, the kiwi pair drops for the first time in the last eight days while also ignoring upbeat prints of China’s Caixin Services PMI.
Even so, a confluence of an ascending trend line from August 31 and 100-HMA around 0.6745-40 is likely to question the latest weakness amid normal RSI conditions.
Should sellers sneak in around 0.6740, Monday’s low and July month’s top surrounding 0.6720/15 will be additional support that can challenge the pair’s further downside towards the sub-0.6700 area.
Meanwhile, the descending trend line from the previous day near 0.6775 becomes the immediate upside barrier ahead of the multi-month high flashed on Wednesday around 0.6790.
It should, however, be noted that 0.6790 is also high of July 2019 and the same will precede the 0.6800 threshold to challenge the bulls afterward.
NZD/USD hourly chart
Trend: Bullish
