- The NZD/USD pair is trapped within a triangle. However, a valid breakout could bring new opportunities.
- When should we buy the NZD/USD pair?
- A strong downwards movement could be activated only by a valid breakdown through the median line (ML).
The NZD/USD price moves sideways after failing to come back to reach the 0.7170 former high. The price action has developed a triangle pattern. We’ll have to wait for the price to escape from this pattern before taking action. It’s located in a neutral zone, so we don’t have a good trading opportunity right now.
-Are you looking for automated trading? Check our detailed guide-
As you already know, the United States economic figures have come in mixed. The Dollar Index is fighting hard to stay above the 92.47 level and above the weekly pivot point of 92.51. The NZD/USD pair maintains a bullish bias despite the most recent retreat. US Industrial Production registered only a 0.4% growth in the previous month versus a 0.5% estimate compared to 0.8% growth in July. The USD can be affected by this indicator. Moreover, the Empire State Manufacturing Index and the Capacity Utilization Rate indicators have come in better than expected.
Technically, the outlook is bullish, but it remains to see what will happen tomorrow after the New Zealand GDP and the US retail sales data. The Gross Domestic Product is expected to rise by 1.1% in Q2 versus 1.6% in Q1.
The US Retail Sales indicator could remain deep in the negative territory. It’s expected to register a 0.7% drop, while the Core Retail Sales may decline by 0.1%. Thus, poor US figures could force the greenback to depreciate.
NZD/USD price technical analysis: Potential triangle breakout
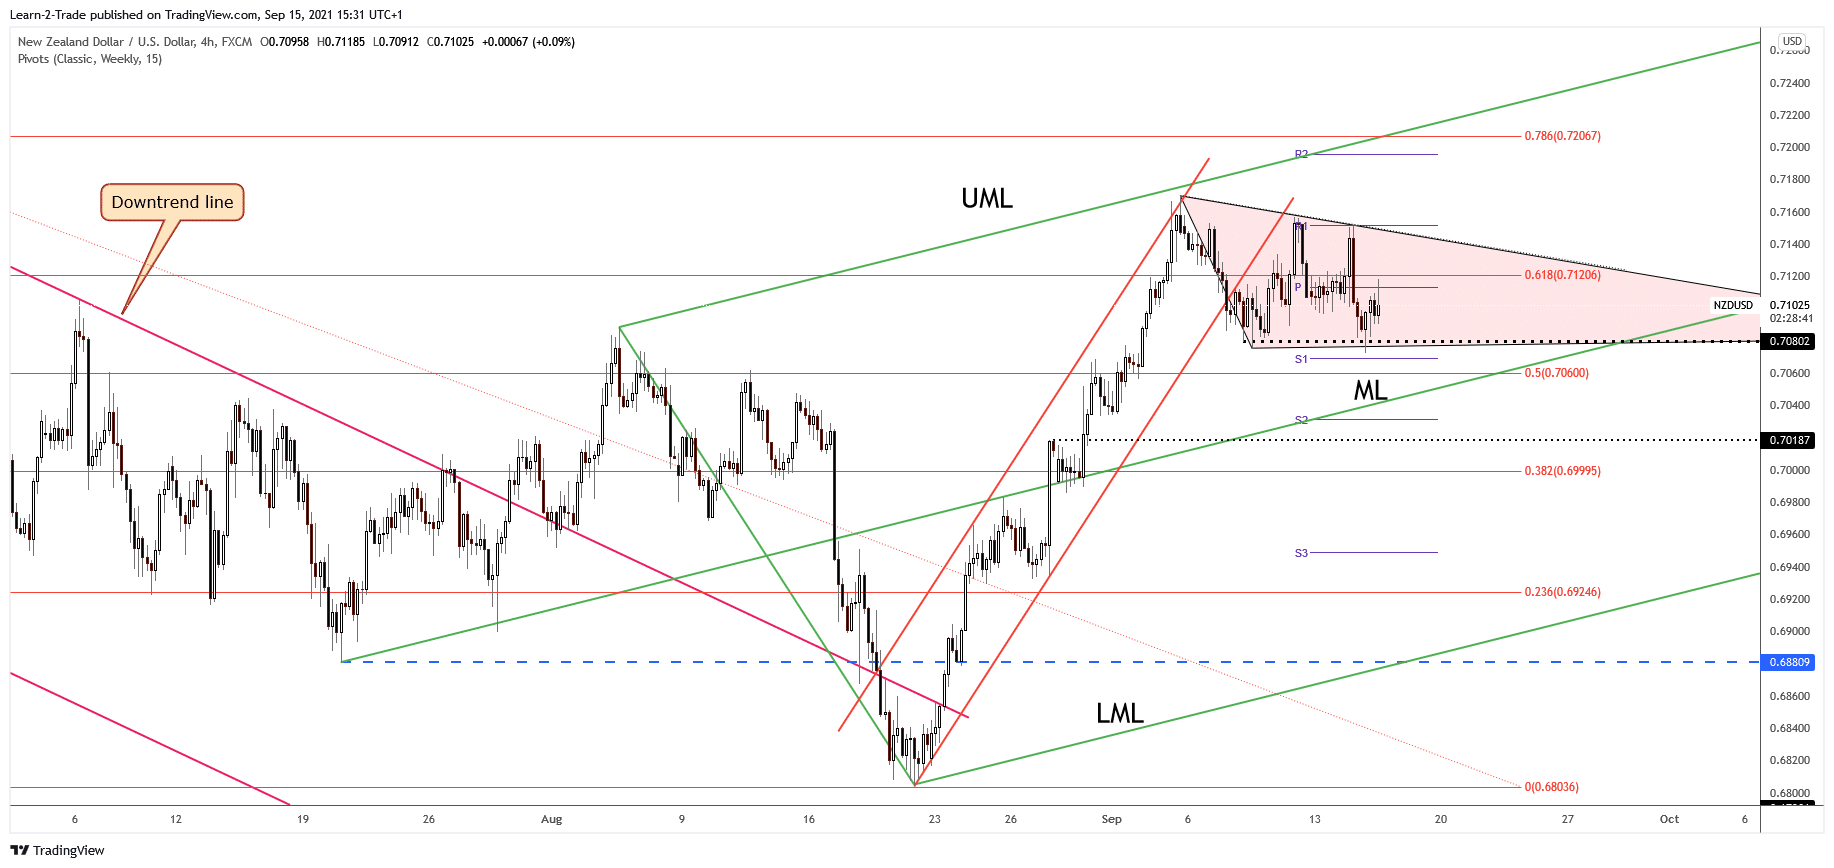
The NZD/USD price registered a new false breakdown through the 0.7080 level and now is pressuring the 0.71 and the weekly pivot point 0.7113 level. Personally, I’ll wait for the price to escape from this triangle before taking action again. Technically, the pair is bullish as long as it stays above the ascending pitchfork’s median line (ml). So, a downside breakout from the current triangle doesn’t mean that the price may develop a strong decline.
-If you are interested in forex day trading then have a read of our guide to getting started-
On the other hand, the NZD/USD pair could print an important upwards movement after making a valid breakout through the triangle’s resistance, printing a new higher high.
Looking to trade forex now? Invest at eToro!
75% of retail investor accounts lose money when trading CFDs with this provider. You should consider whether you can afford to take the high risk of losing your money.
