- The NZD/USD pair reached a resistance area, and now it has turned to the downside.
- A valid breakdown through the confluence area activates more declines.
- The US data could be decisive later today.
The NZD/USD price climbed as high as 0.5805 today, registering a new high on the short-term horizon. The pair is trading at 0.5733 at the time of writing.
The price retreated as the Dollar Index bounced back. Fundamentally, the USD depreciated in the last few days because the ISM Manufacturing PMI and JOLTS Job Openings came in worse than expected.
Today, the RBNZ is seen as a high-impact event. The Official Cash Rate was increased from 3.00% to 3.50%, as expected. More rate hikes are expected in the next monetary policy meeting. Later, the US data could be decisive.
The ADP Non-Farm Employment Change is expected at 200K in September versus 132K in August, while ISM Services PMI could drop from 56.9 points to 56.0 points. In addition, the US Trade Balance is expected at -67.8B, while the Final Services indicator could remain steady at 49.2 points.
The fundamentals could move the markets in the coming days. The US NFP, Unemployment Rate, and the Average Hourly Earnings data will be released on Friday.
Dollar Index price technical analysis: Down channel
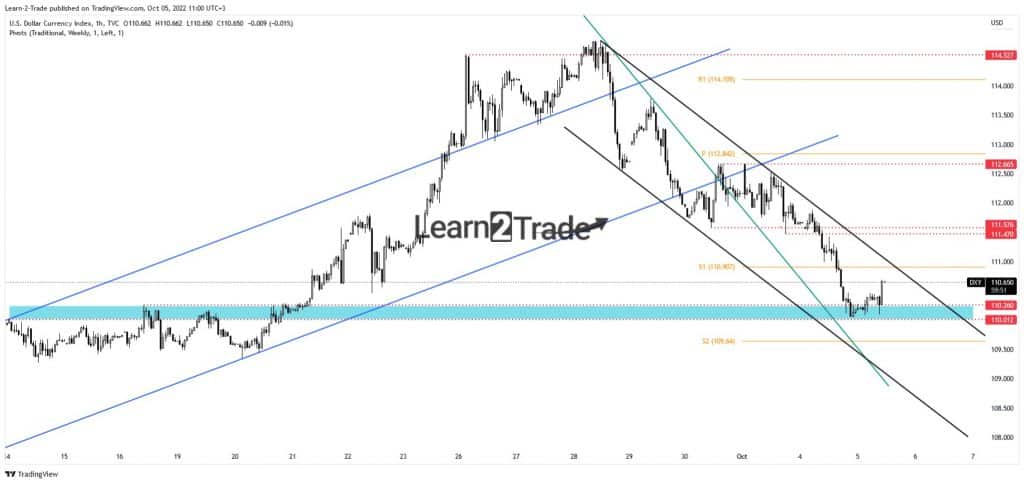
The Dollar Index was in a corrective phase after failing to stabilize above the 114.52 level. Now, it has rebounded after reaching the 110.01 – 110.26 zone. Still, the bias remains bearish as long as it stays under the downtrend line. DXY’s deeper drop should force the greenback to lose more ground versus its rivals. Only a valid breakout may signal a potential swing higher.
–Are you interested to learn more about Canada forex brokers? Check our detailed guide-
NZD/USD price technical analysis: Swing higher
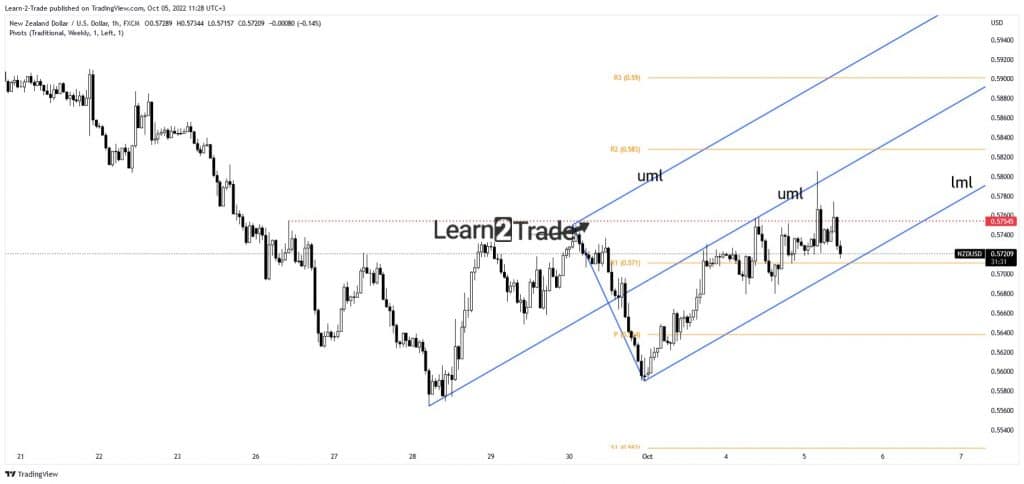
The NZD/USD pair registered only false breakouts above the 0.5754 static resistance and through the median line (ml). Now, it is almost to reach the weekly R1 (0.5710) and the lower median line (LML), which represent dynamic support.
Technically, the confluence area formed between these immediate downside obstacles could represent a support zone. False breakdowns invalidate a deeper drop and announce a new upside momentum. A valid breakdown through the confluence area activates more declines.
Looking to trade forex now? Invest at eToro!
68% of retail investor accounts lose money when trading CFDs with this provider. You should consider whether you can afford to take the high risk of losing your money.
